In this tutorial, I will explain how to set up Zabbix with Docker to monitor your server and network infrastructure.
For those who follow me regularly, I have long been a fan of PRTG for its “simplicity” but which has certain limits compared to Zabbix. I will come back to it in an article explaining why today I prefer Zabbix.
Introducing Zabbix
If you don’t know Zabbix, I’ll give you a quick presentation, you can also read the page Wikipedia.
Zabbix is an open source network and system monitoring utility (servers, applications, databases, etc.). Zabbix works under Linux environment, it can be installed directly on Linux or in container using Docker.
Zabbix is composed of several elements:
- The Zabbix server which is the monitoring service, it is published on port 10051, it is responsible for interrogating equipment, collecting and processing data.
- The database where the information is stored, it is possible to use MySQL/MariaDB, PostgreSQL or even Oracle.
- The user interface, which is a graphical interface written in PHP, it is possible to use different web server (Apache2, Nginx)
- There is also a Java agent for monitoring Jvm.
- Zabbix proxy: which is an optional component, which can be used on remote sites to centralize supervision by it or on large infrastructure to distribute the load.
To monitor devices, Zabbix supports several methods:
- Agent :it is possible to install an agent on the servers (Windows / Linux) to collect the data and then send it to the servers or or proxy, there are two versions of the agent, one version written in C and the other in Go (Zabbix Agent 2).https://www.zabbix.com/documentation/current/en/manual/appendix/agent_comparison Agents also have two methods of operation (active and passive). To put it simply, in passive mode (default mode), it is the Zabbix server (or the proxy) that will contact the agent and ask it for the metrics, in active mode, the agent retrieves its configuration from the Zabbix server (or proxy) and then sends the data to the servers.
- SNMP : Like all monitoring tools, Zabbix supports SNMP protocol.
- IPMI : which is a standard protocol for the supervision of physical elements like Idrac / Ilo.
Prerequisites
As I said in the introduction, we are going to use Docker to “install” Zabbix, so you will need a Linux server (for me Ubuntu) with Docker and Docker Compose installed.
If you are using Ubuntu, here is a script for installing Docker and Docker Compose:
Installing Zabbix with docker-compose
For Zabbix installation with Docker, we will use a docker-compose.yml file to configure Zabbix differents:
- The Zabbix server
- The database (MariaDB)
- The web interface
- A monitoring agent for Zabbix server.
To make it easier for you, I have created a repository with the necessary files which can be found here : https://git.rdr-it.io/docker/zabbix.
On your server created a folder, which will receive a copy of the repository files and Zabbix data.
On my server, I will use the /containers/zabbix folder.
Once in your folder, enter the command below to clone the repository:
sudo git clone https://git.rdr-it.io/docker/zabbix.git .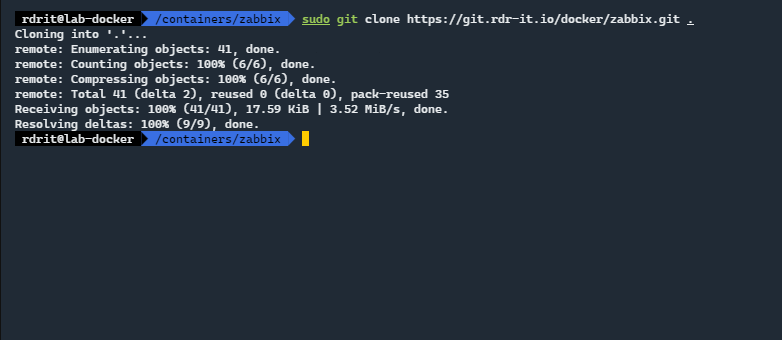
If we display the content, we have the files:
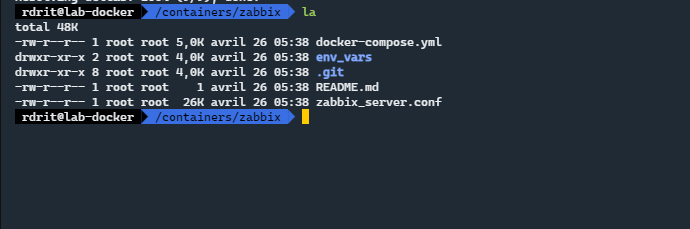
We have the docker-compose.yml file, which contains the definitions of the different containers.
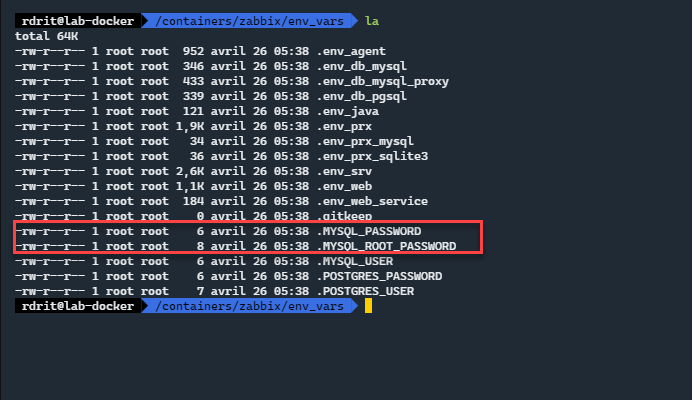
Before recovering the images and starting them, I advise you to modify the passwords for the MariaDB database.
Go to the env_vars folder which contains the various configuration files.
cd env_varsAt a minimum, edit the .MYSQL_PASSWORD and .MYSQL_ROOT_PASSWORD files, change to a personalized password.
Go up one level in the folders to return where the docker-compose.yml file is.
We will now be able to download the images, before I invite you to read the docker-compose.yml file of which here is an overview:
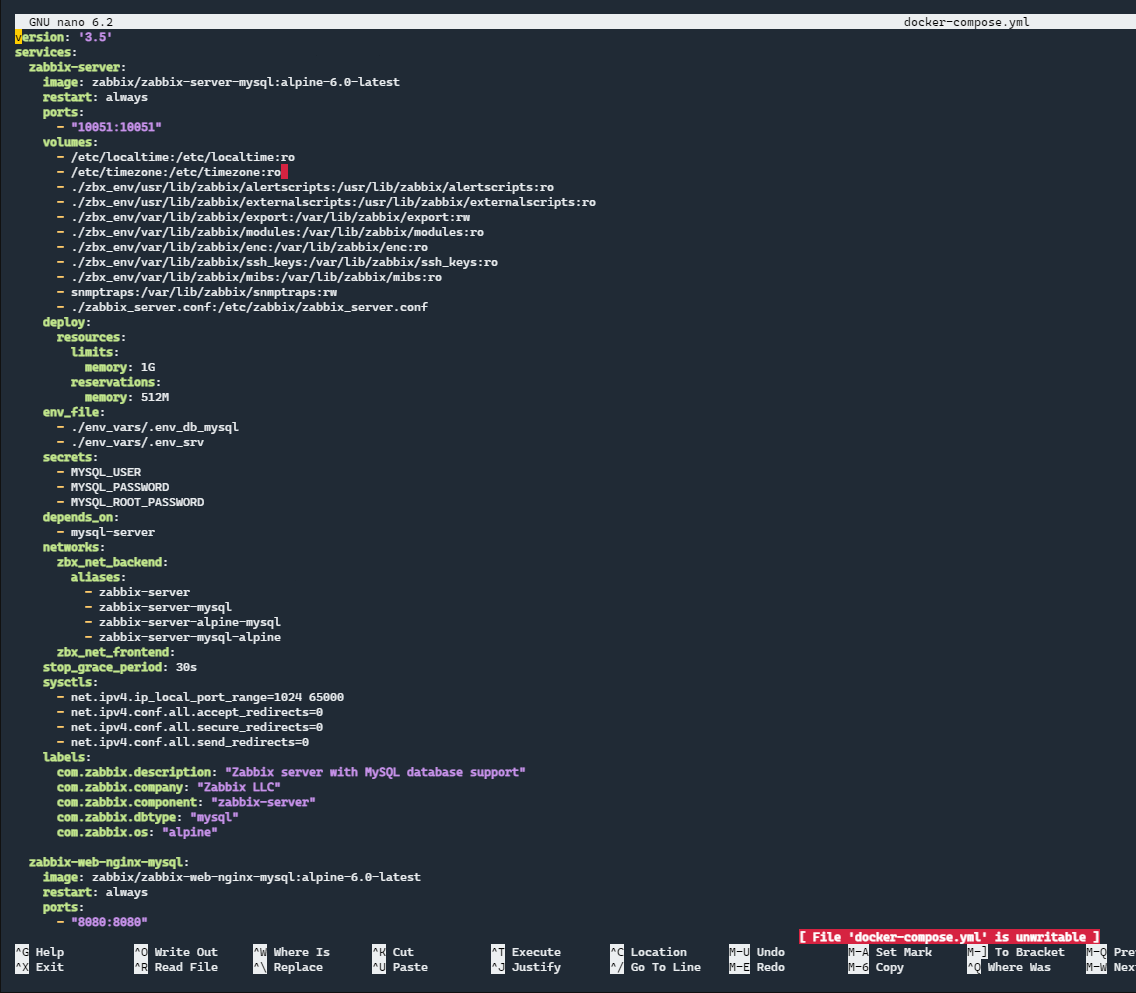
On the screenshot, we can see the configuration of the Zabbix server container and preview of the container that manages the GUI.
By the way, we see that the server is published on port 10051 and that the web server on port 8080.
Depending on your needs, edit the file.
Here we go, we can now download the different images, to do this enter the following command:
sudo docker-compose pull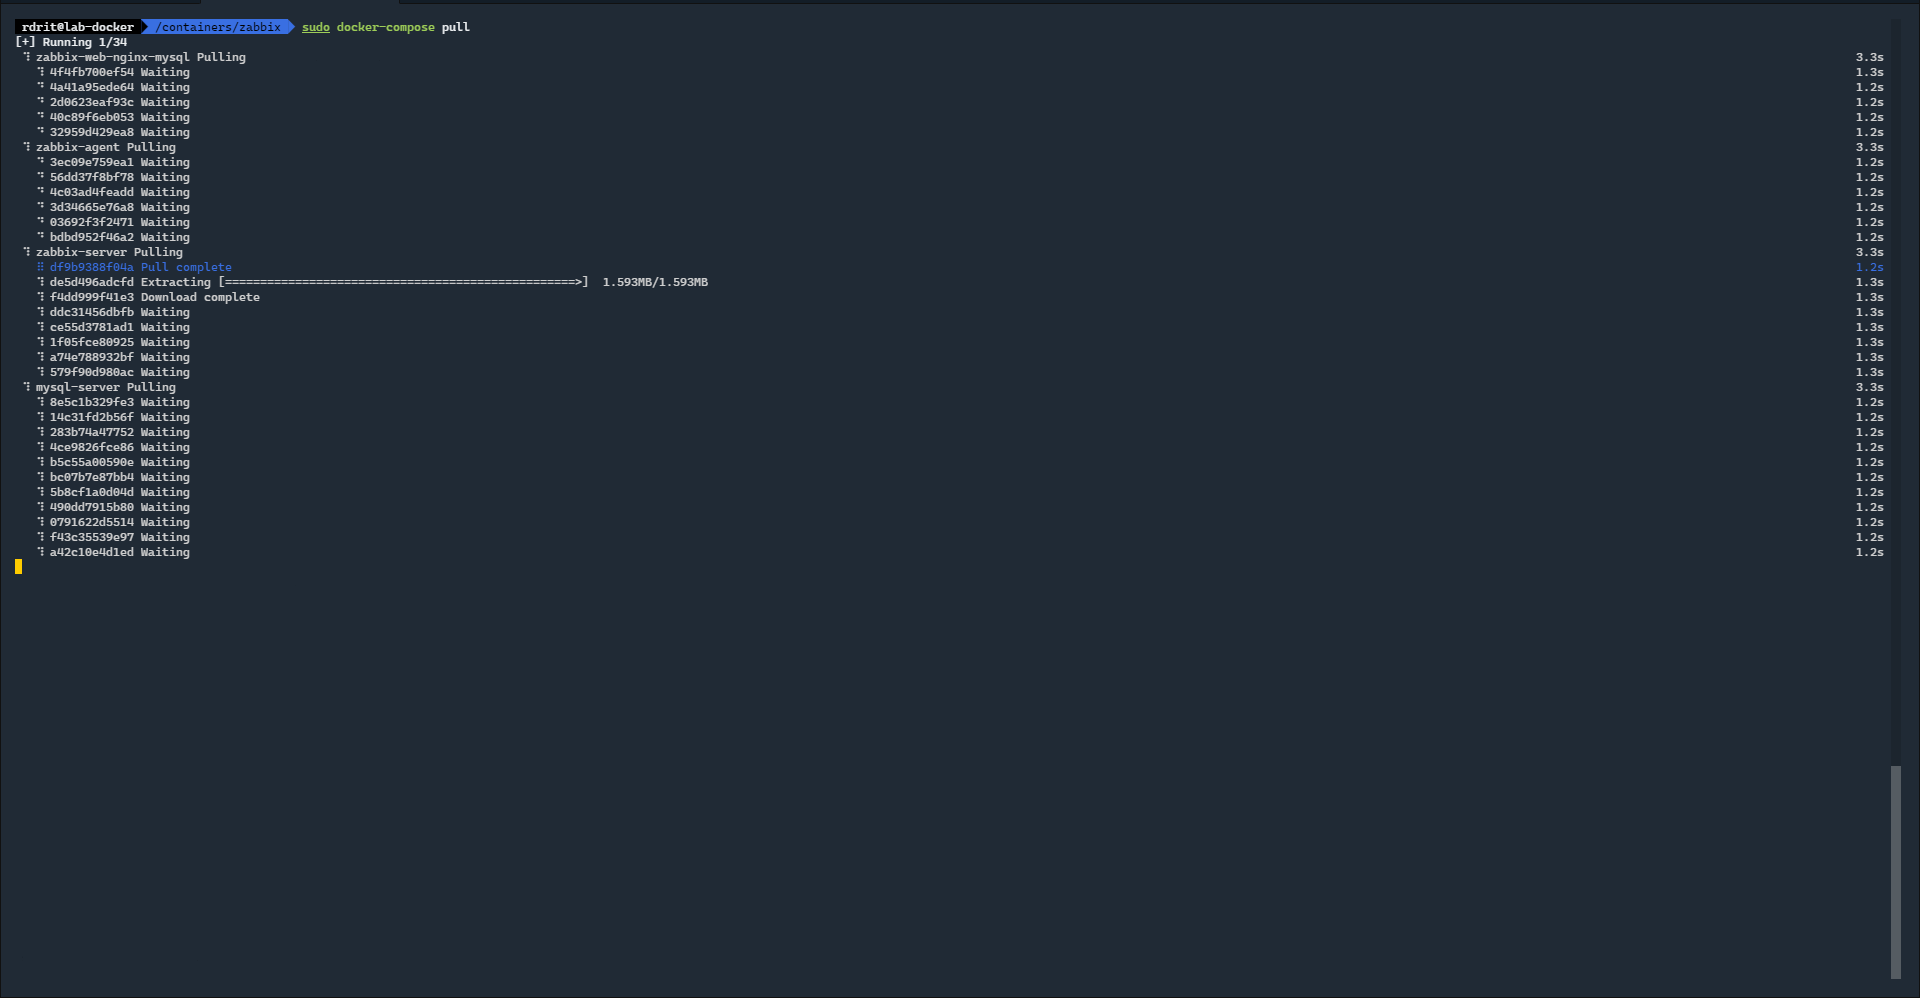
Wait while downloading images.
We will now be able to launch the containers to start Zabbix.
For the first start, I advise you not to detach the execution of the containers in order to have the return in the terminal, for that we started the containers without the -d option.
Enter the following command:
sudo docker-compose up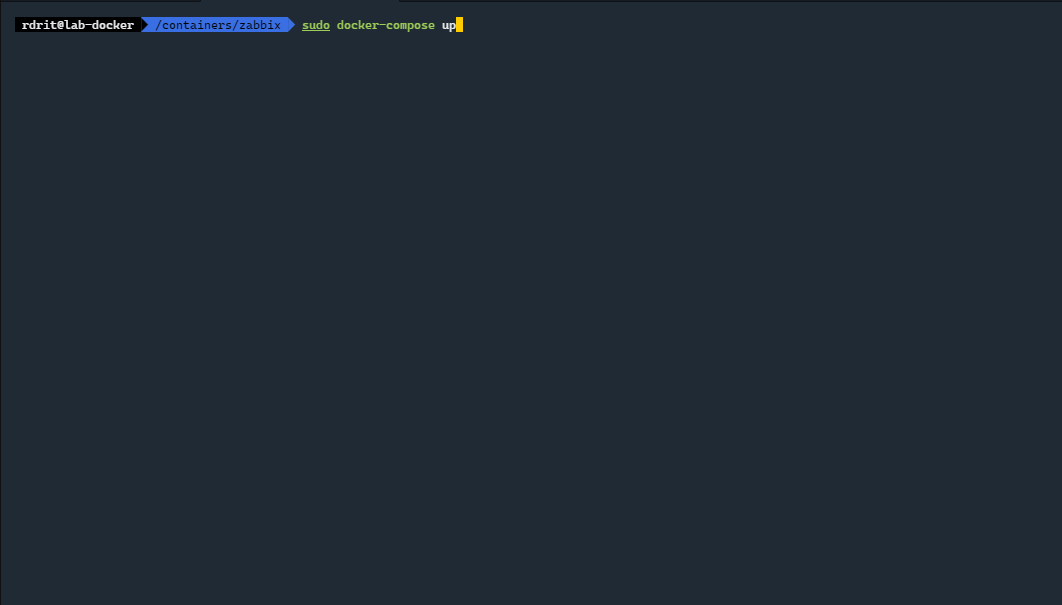
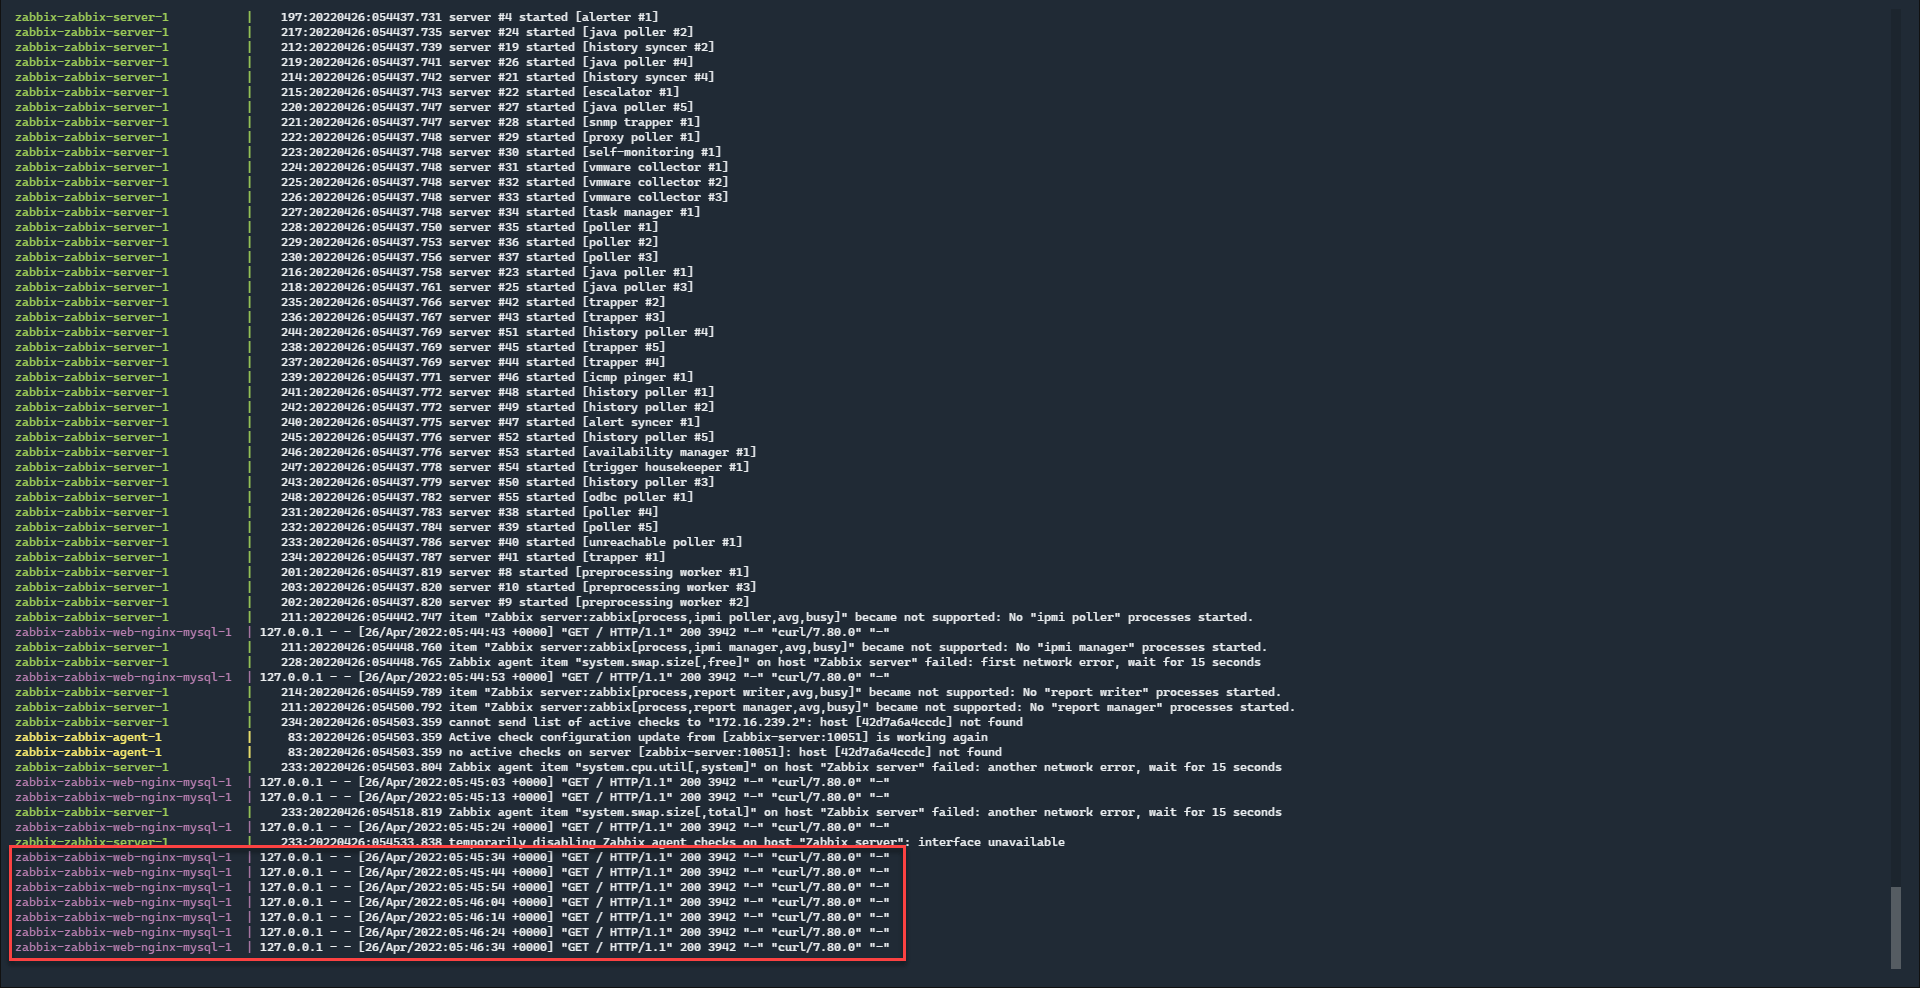
Wait while starting the different images and the “automatic” configuration of Zabbix including the creation of the database.
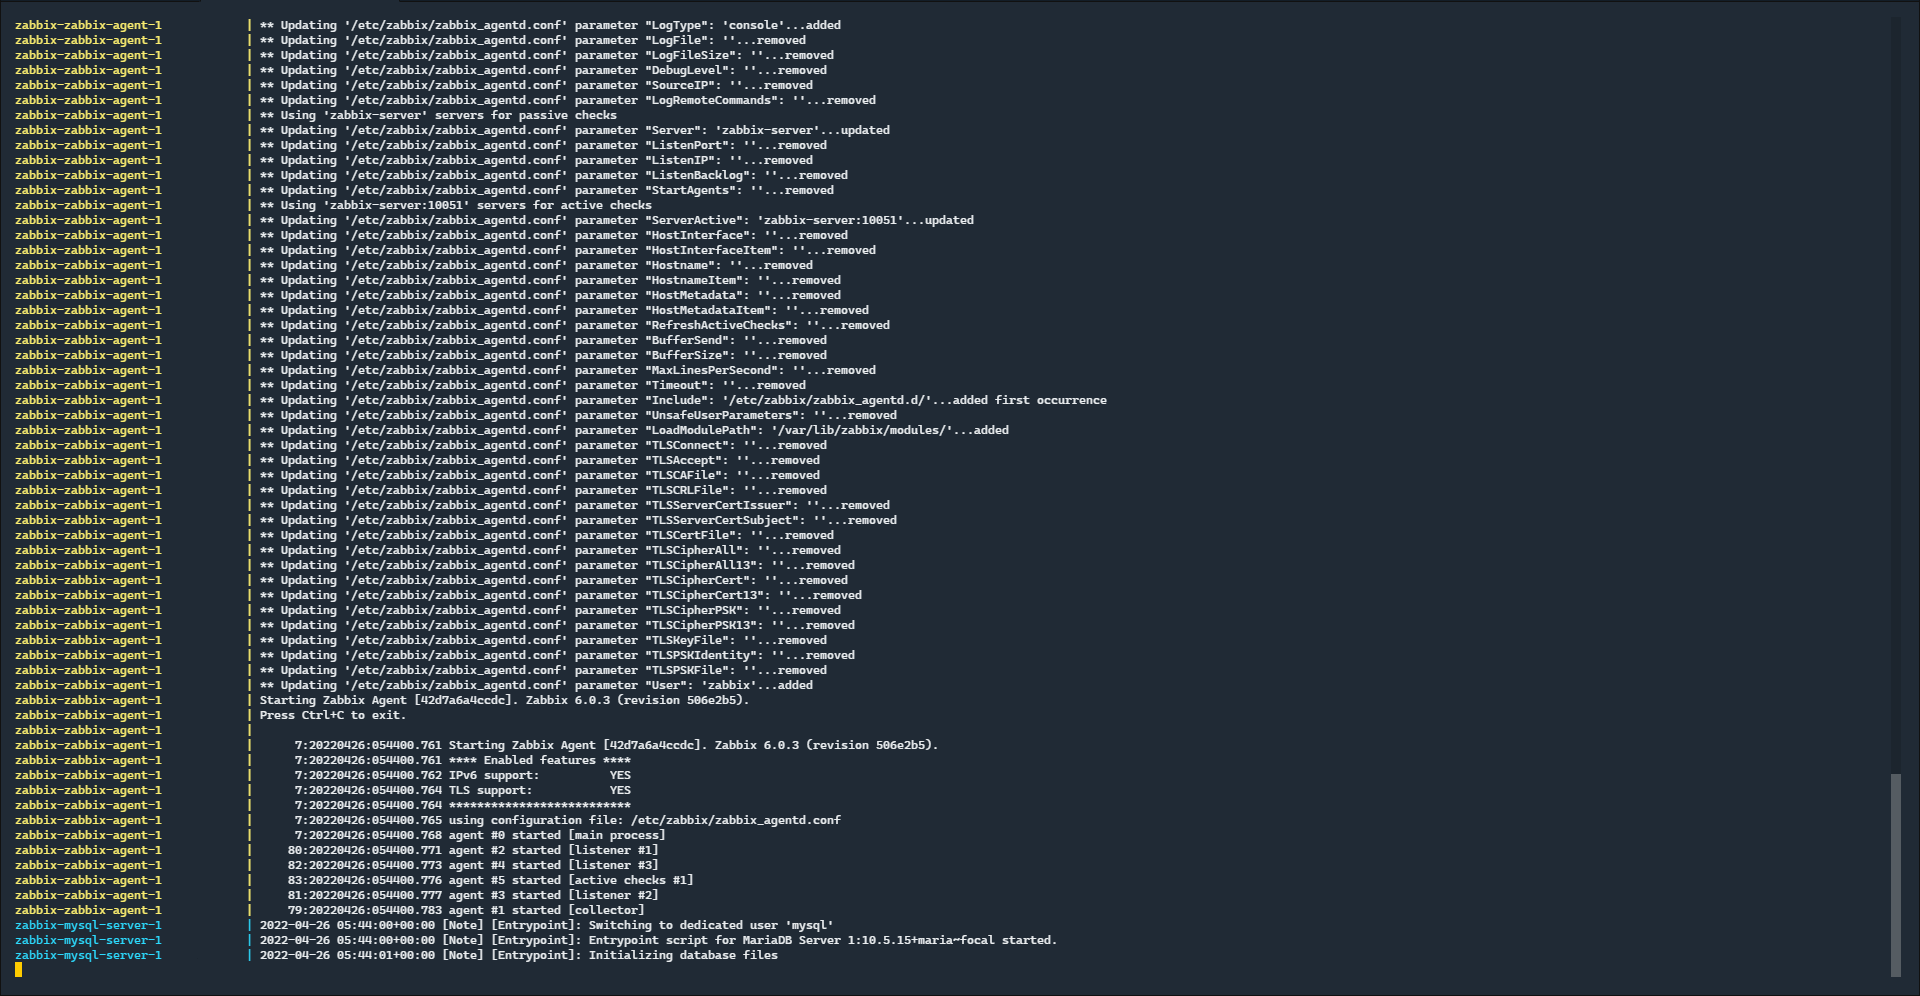
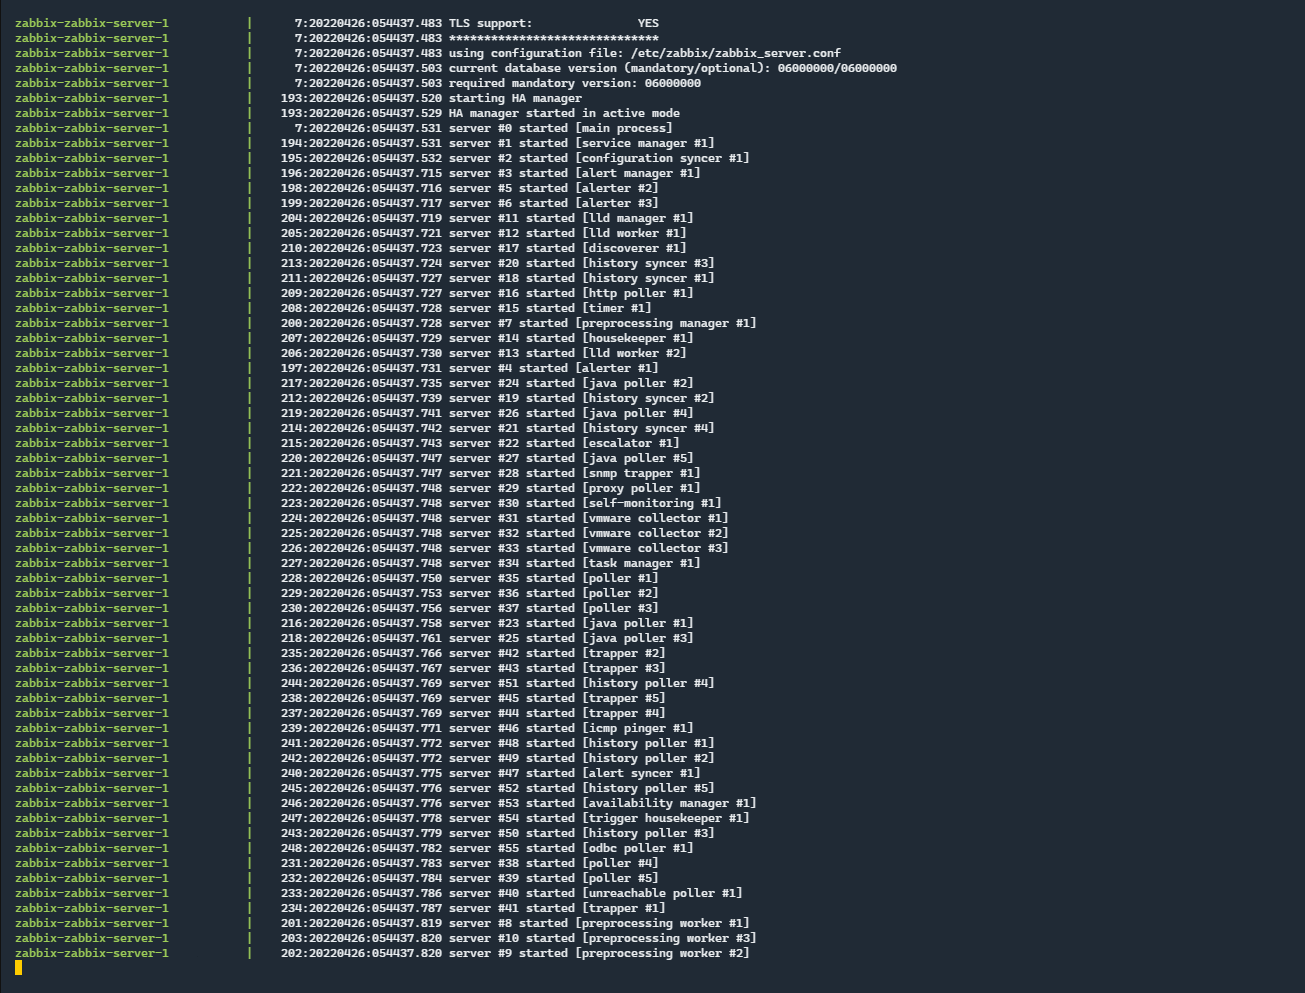
Wait 5 minutes…
When in the terminal, you have in return several lines with curl/7.80.0 we can consider that everything is good.
The best way to find out if everything is working now is to try to go to Zabbix from a browser.
From an Internet browser, enter the address http://ip_server_zabbix:8080, if you arrive on the Zabbix authentication page, it’s all good!
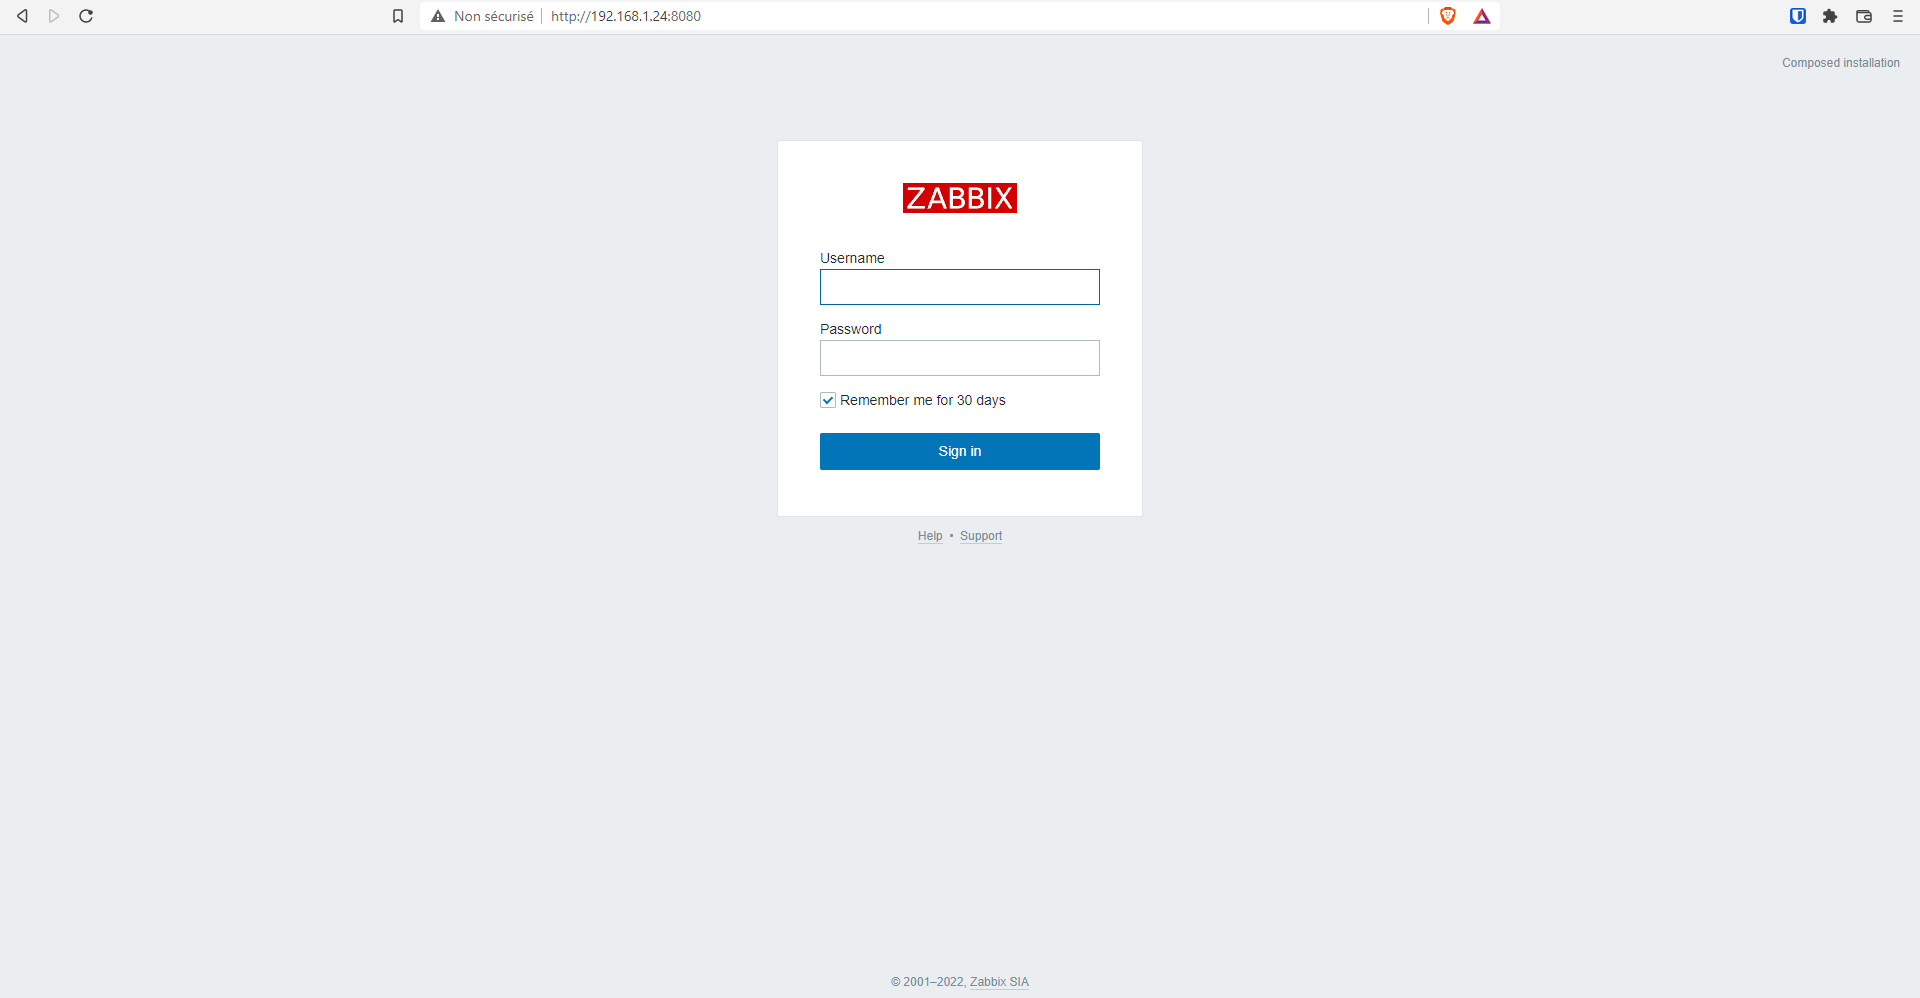
Congratulations, you have deployed Zabbix, but it’s only the beginning!.
First step with Zabbix
Now that our Zabbix server is ready, we will discover its interface and start manipulating it, including configuring the agent that allows monitoring the Zabbix server itself.
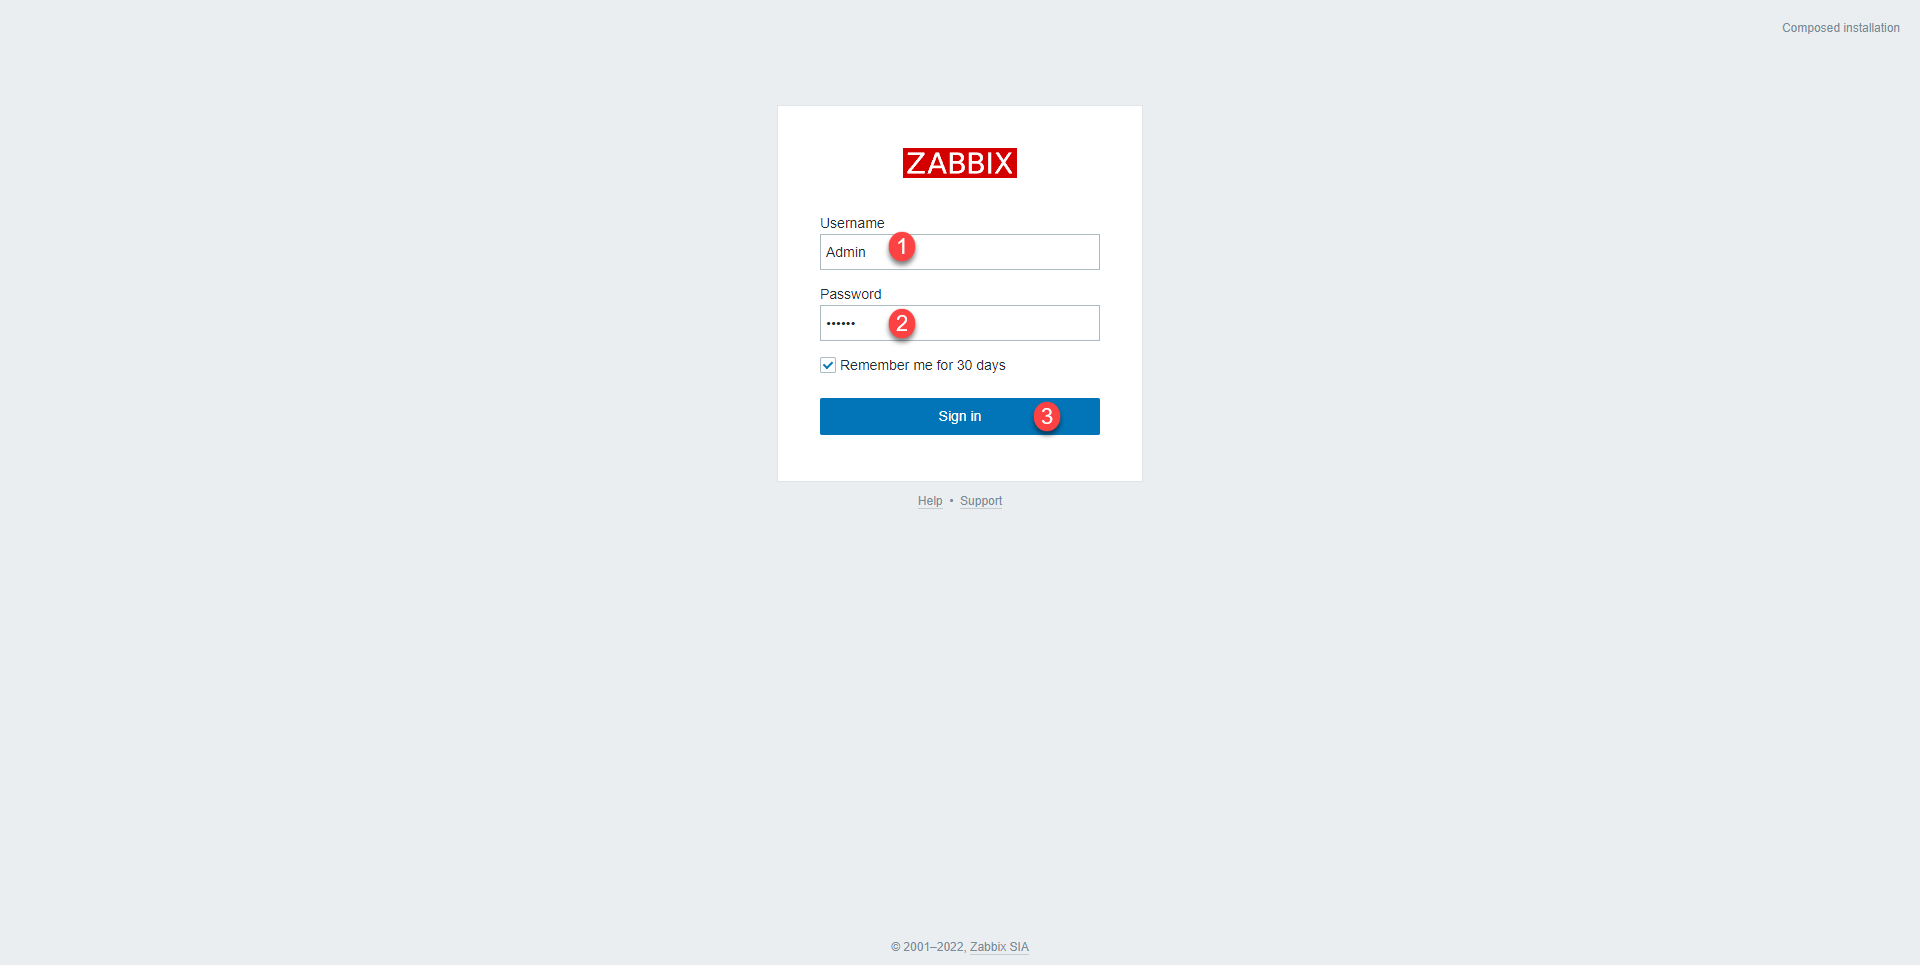
To connect to Zabbix, we will start with the default account whose username is Admin 1 and password zabbix 2, once the credentials are entered, click on Sign in 3 .
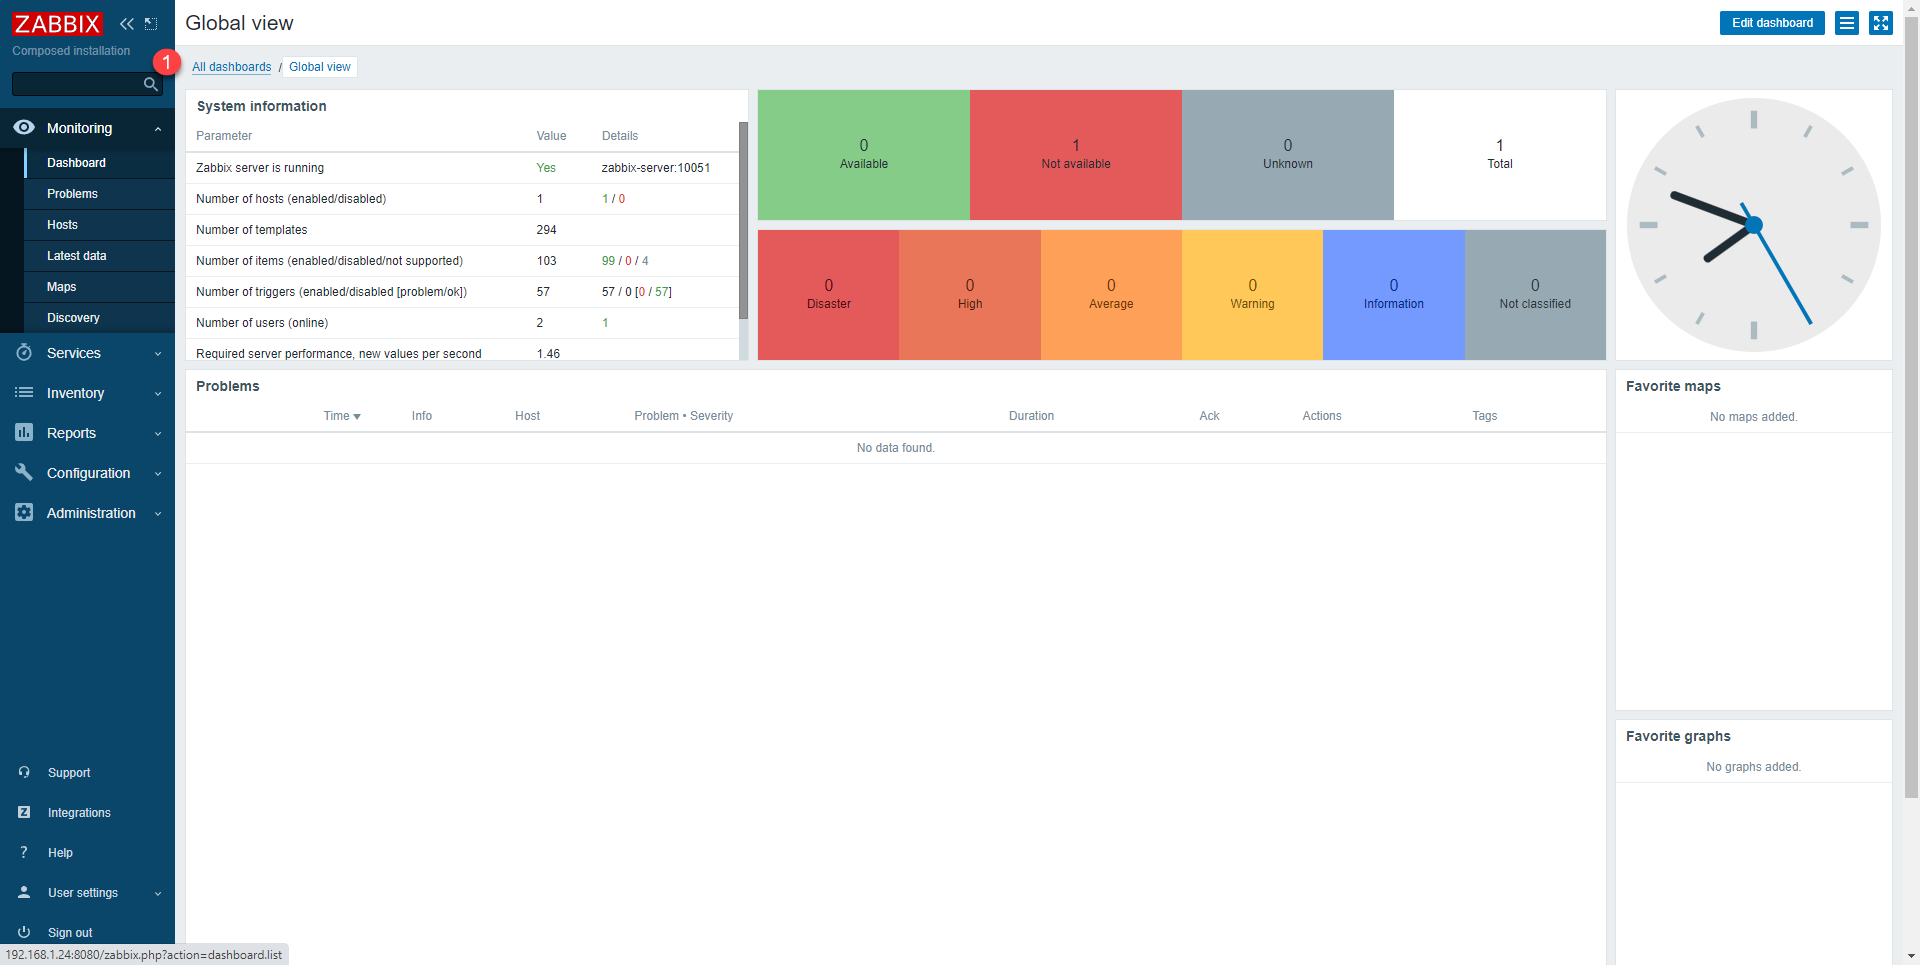
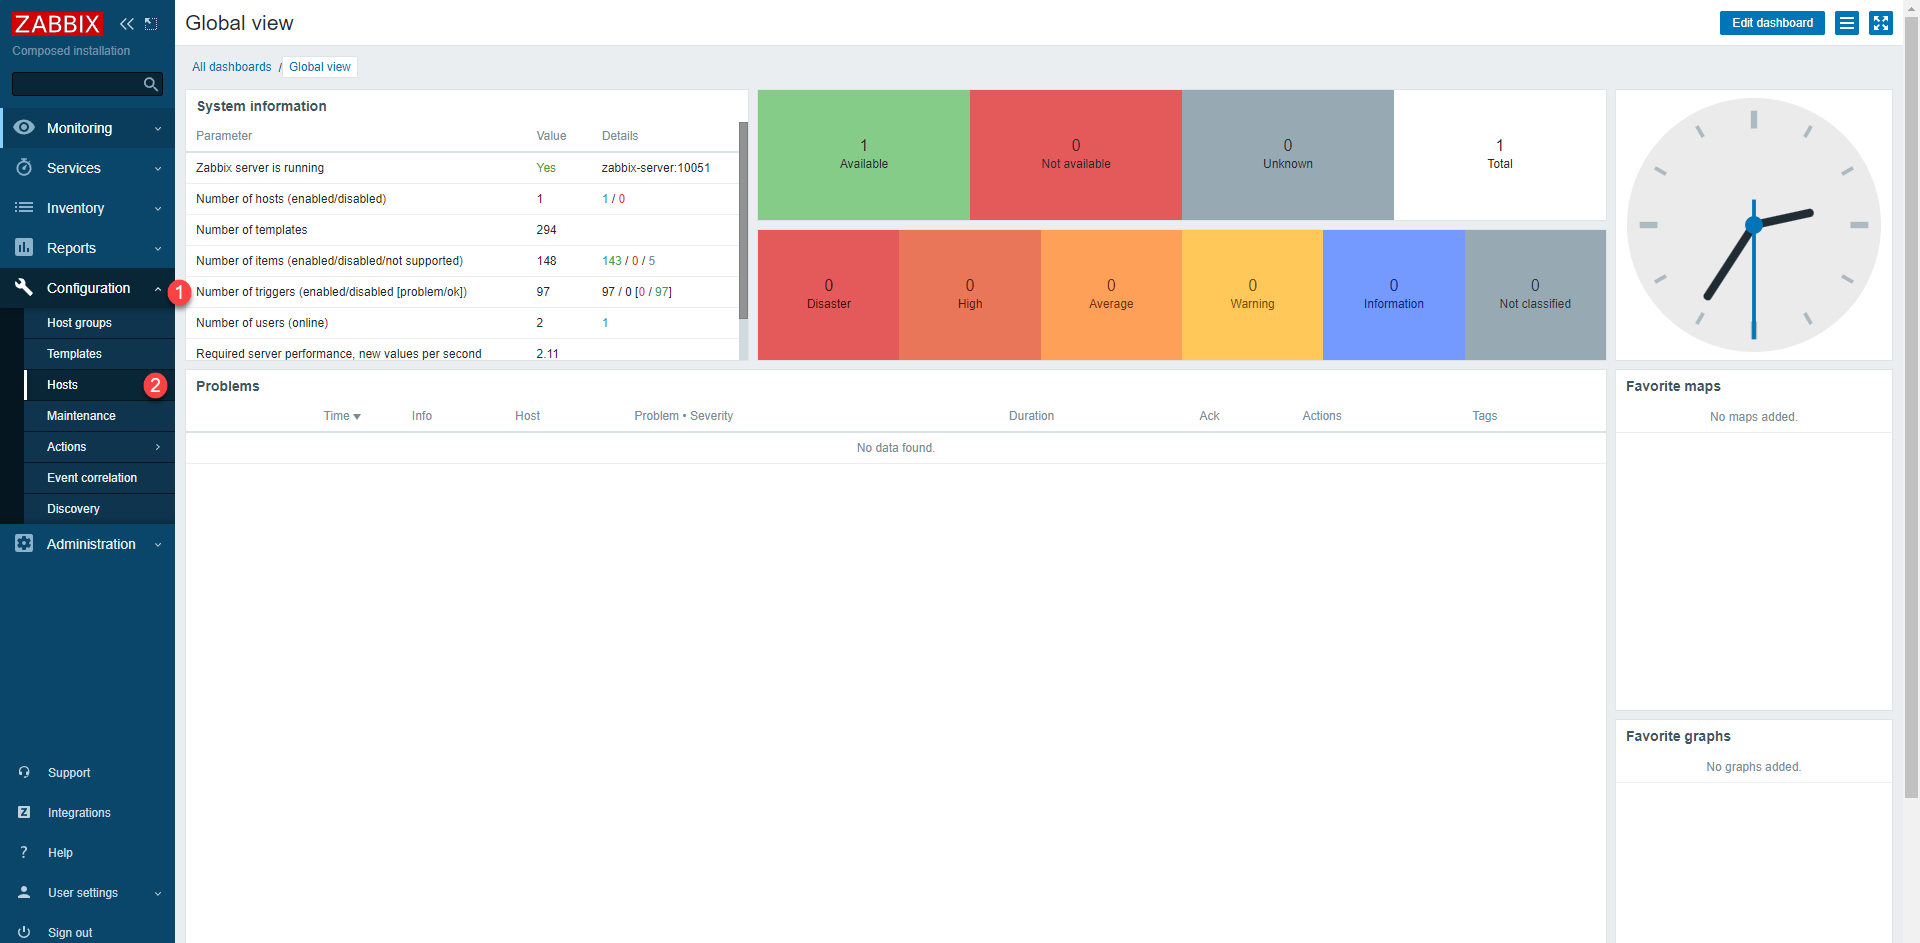
Once connected, we arrive on the page with an empty dashboard (Dashboard) for the moment. This dashboard allows you to see at a glance the different problems, if there are any.
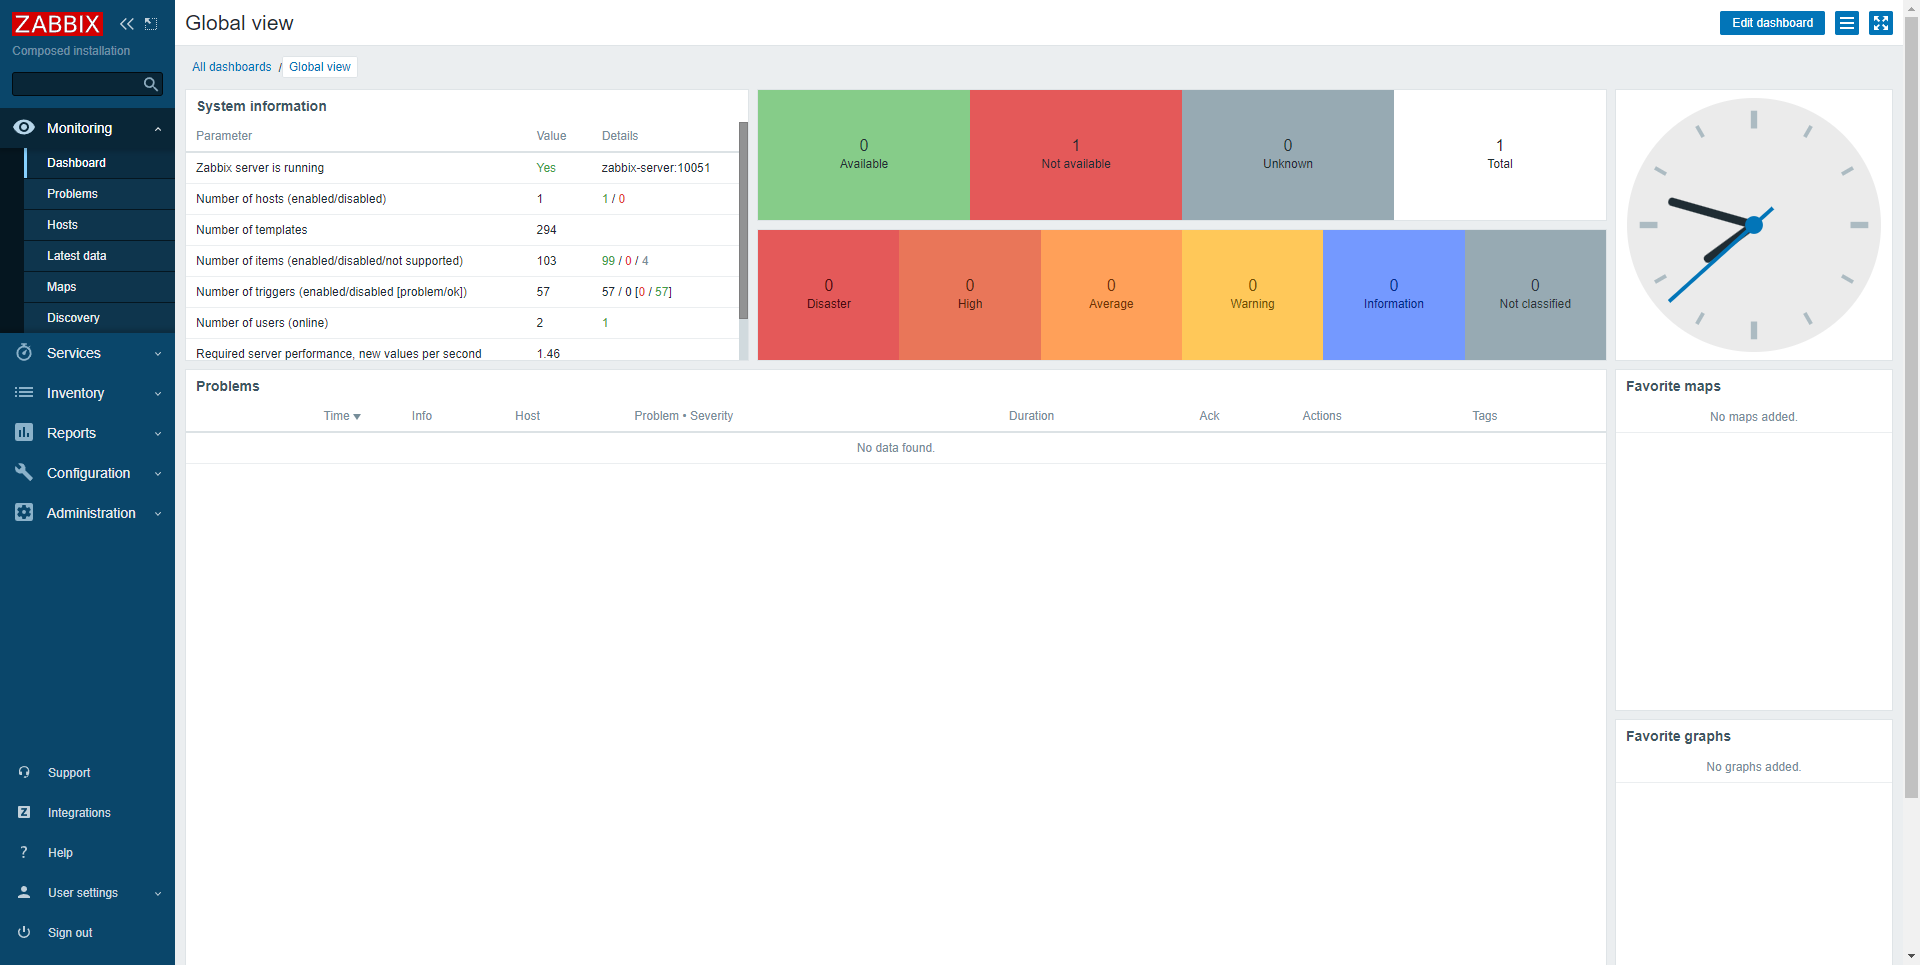
As you can see, the interface is “pretty simple”, on the left part, you have navigation menu that allows access to all the features and configuration of Zabbix, we will see in this tutorial some elements and others will be covered in other tutorials.
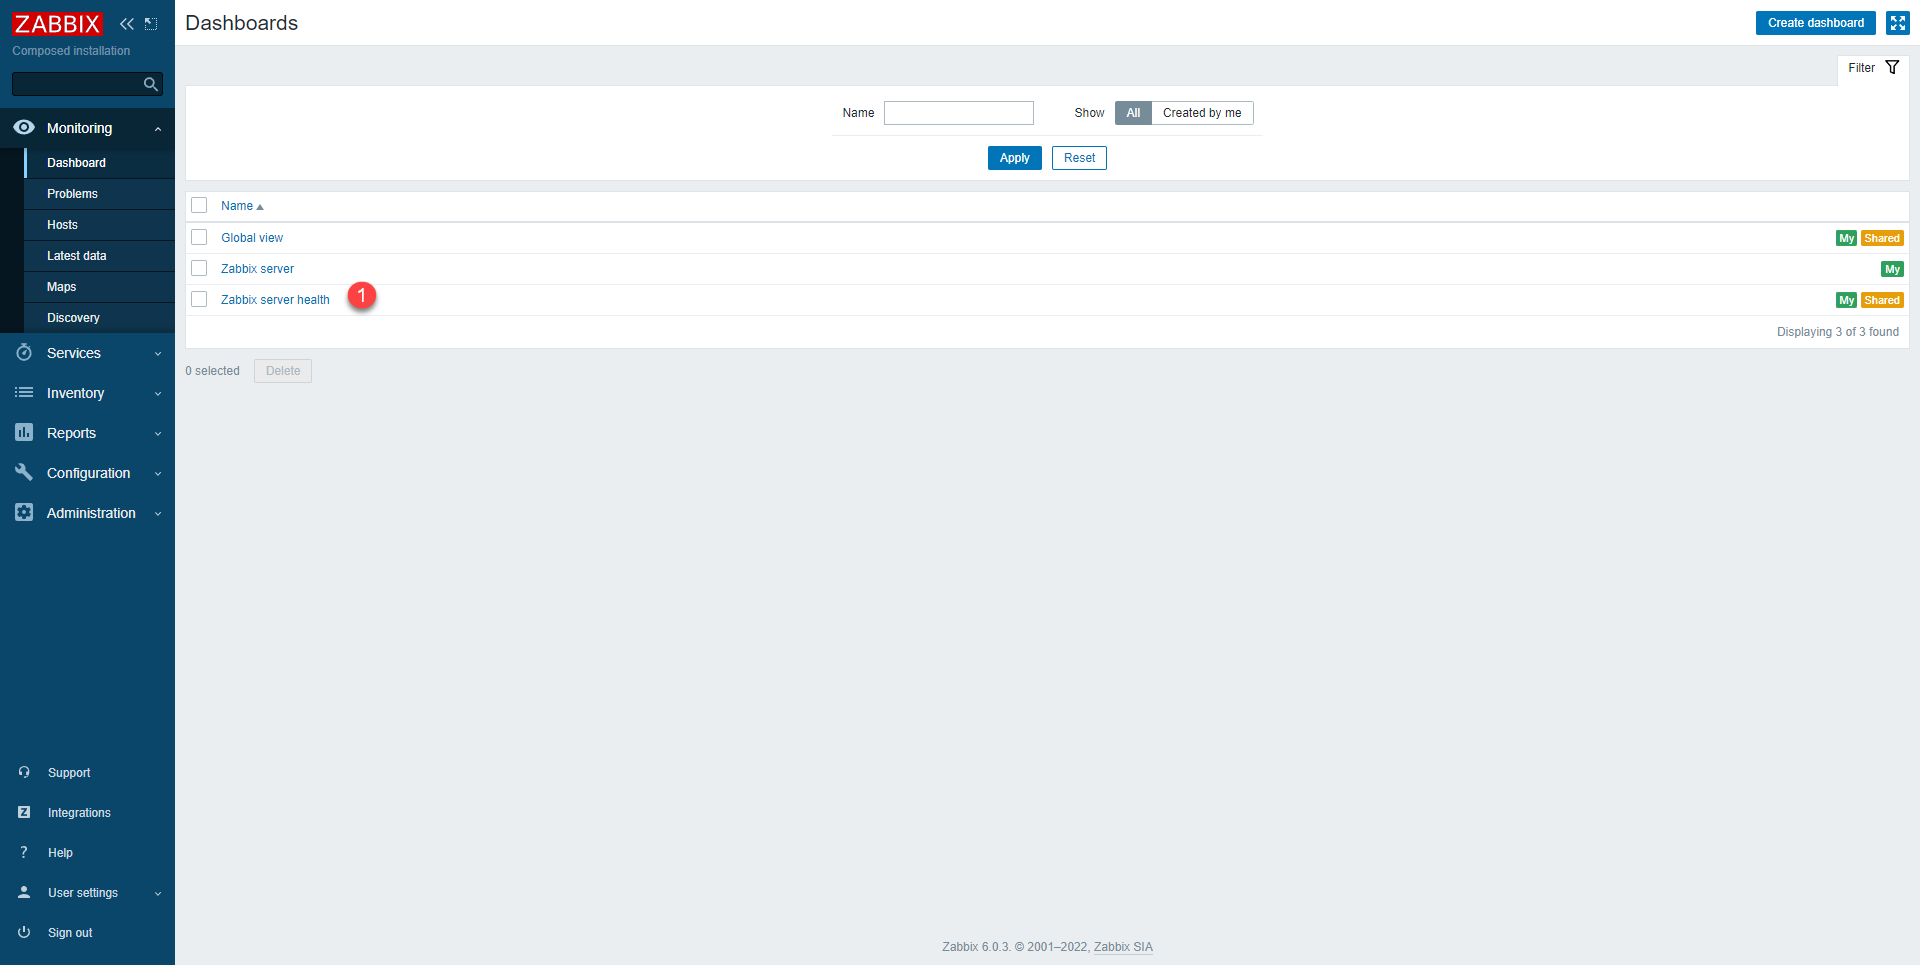
There are several Dashboards available by default, click on All dashboards 1 which is in the breadcrumb.
We arrive on the list of available dashboards, by default there are 3, click on Zabbix server health 1.
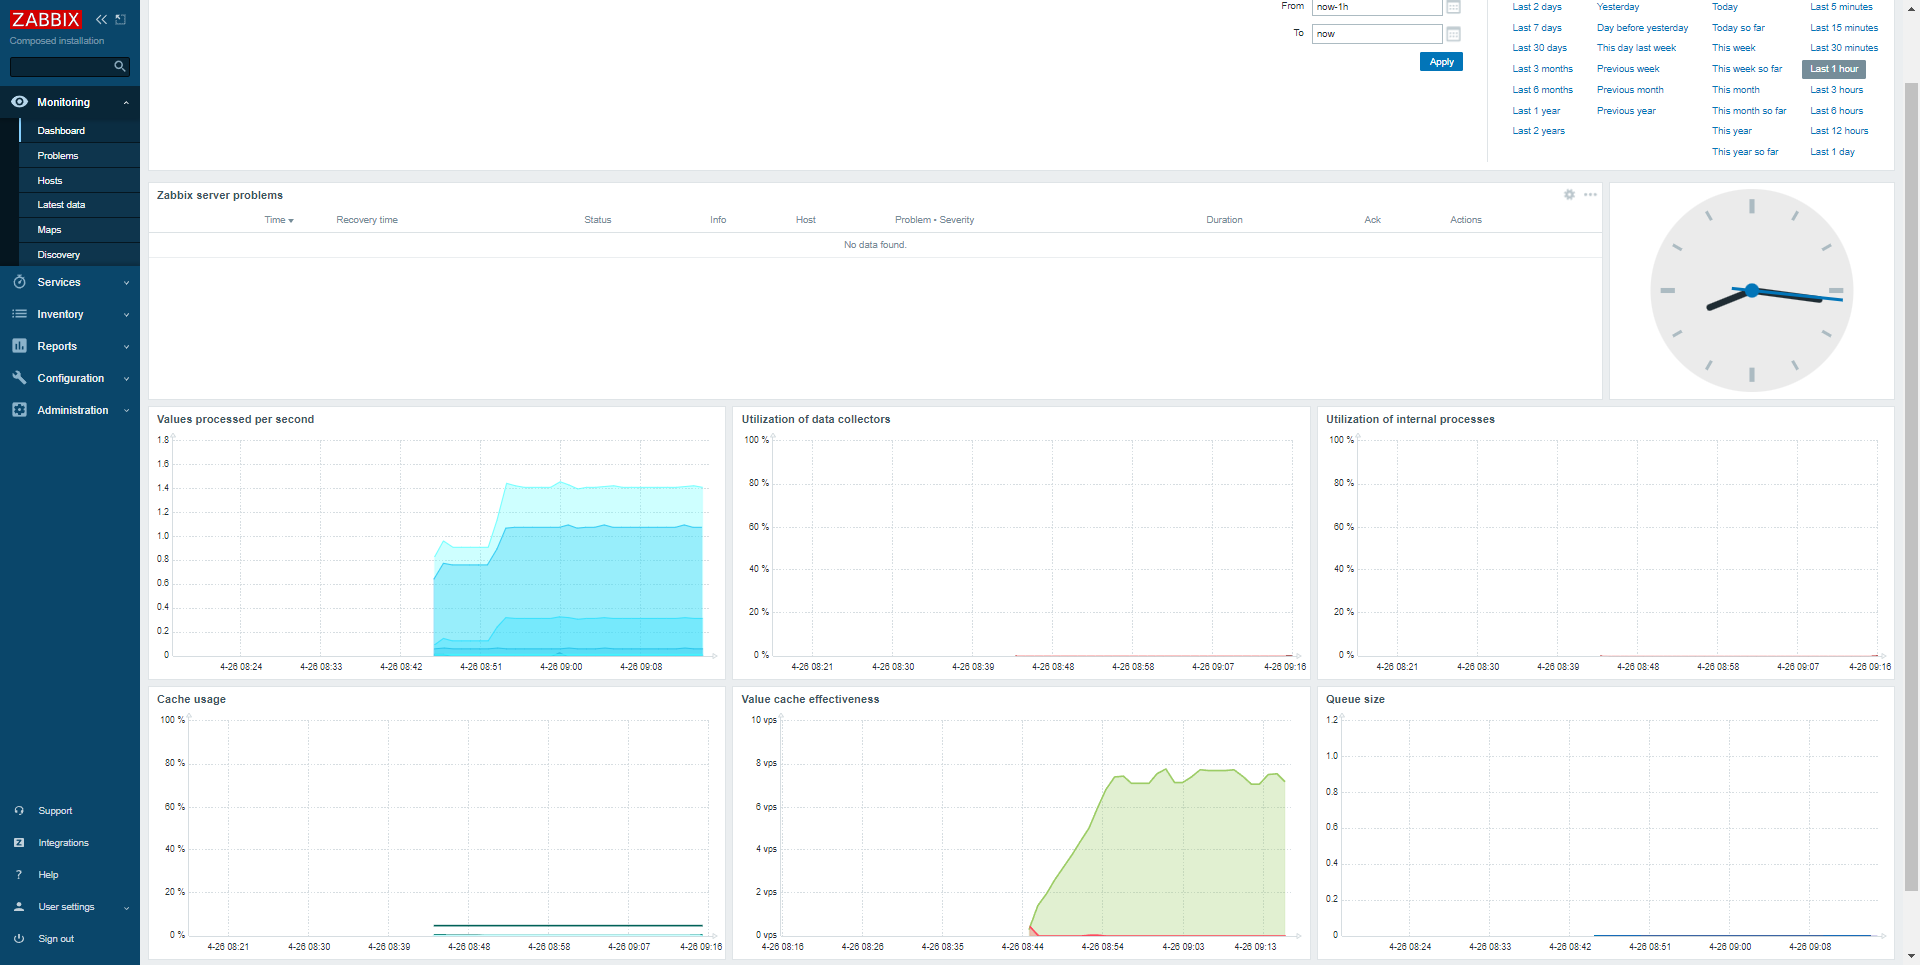
We arrive on the Zabbix server health dashboard
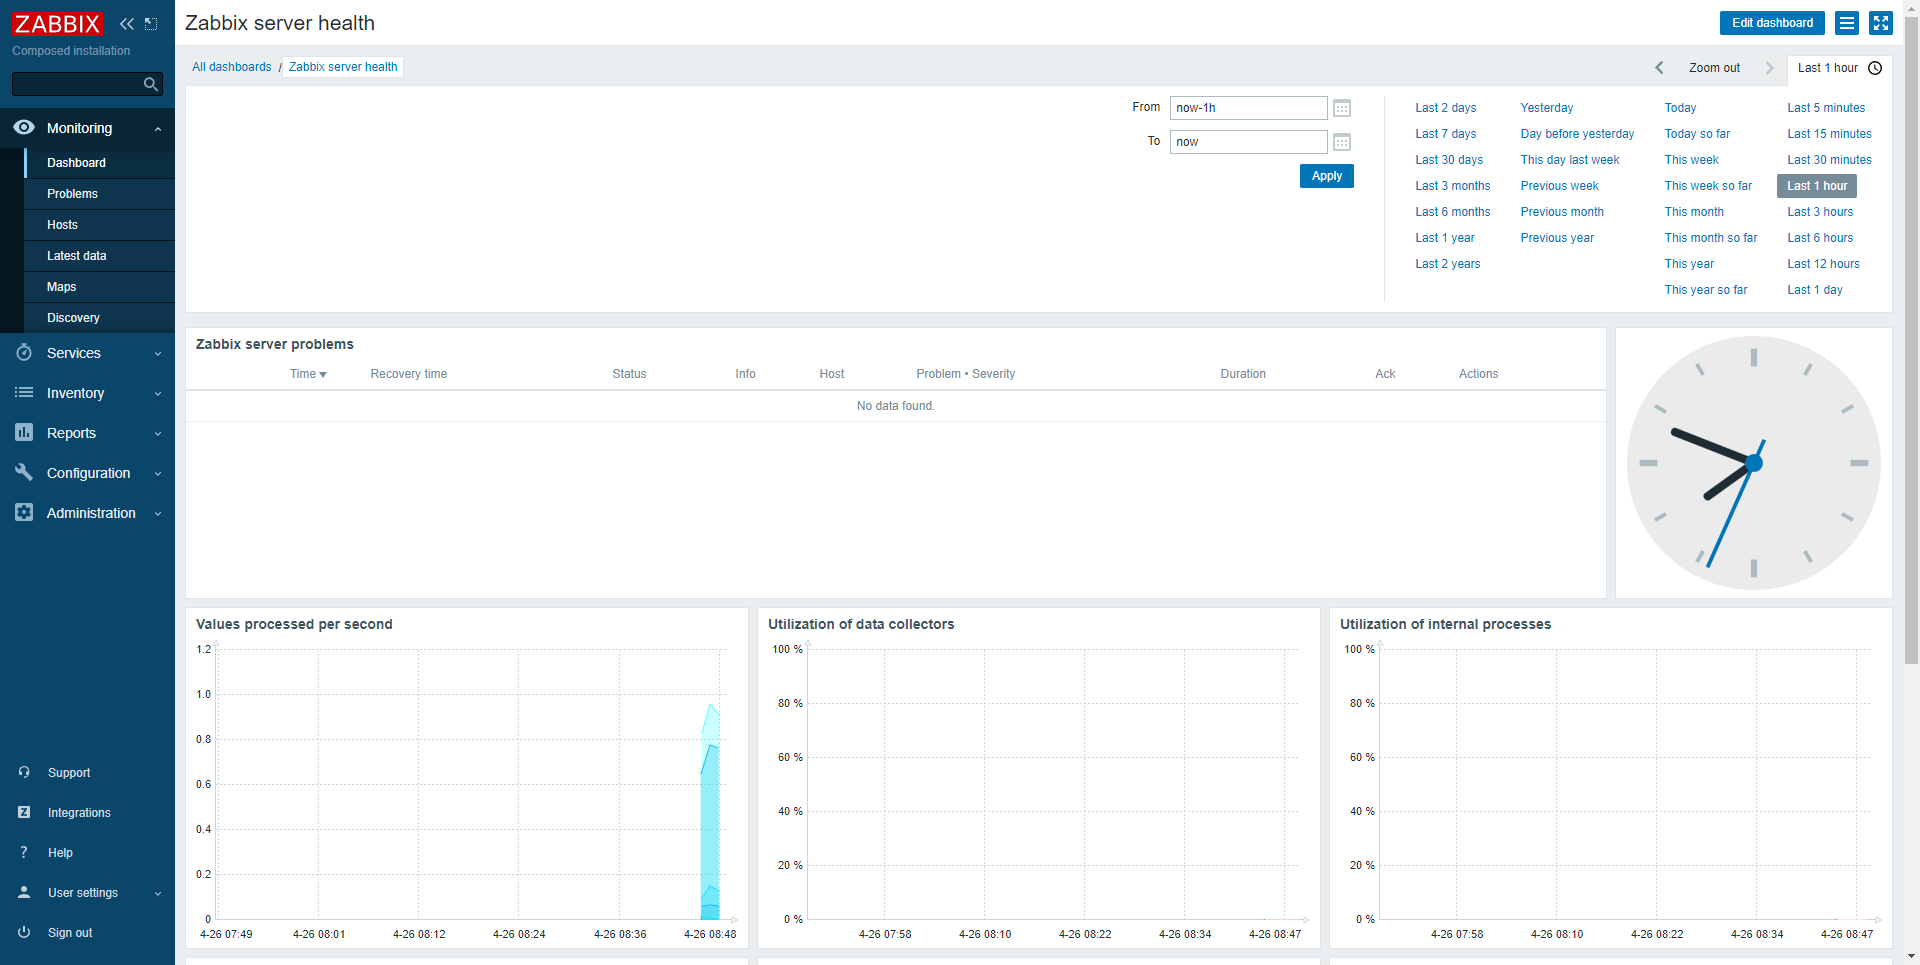
For the moment, this one is incomplete, because the agent is not configured correctly!
For the moment, this one is incomplete, because the agent is not configured correctly!
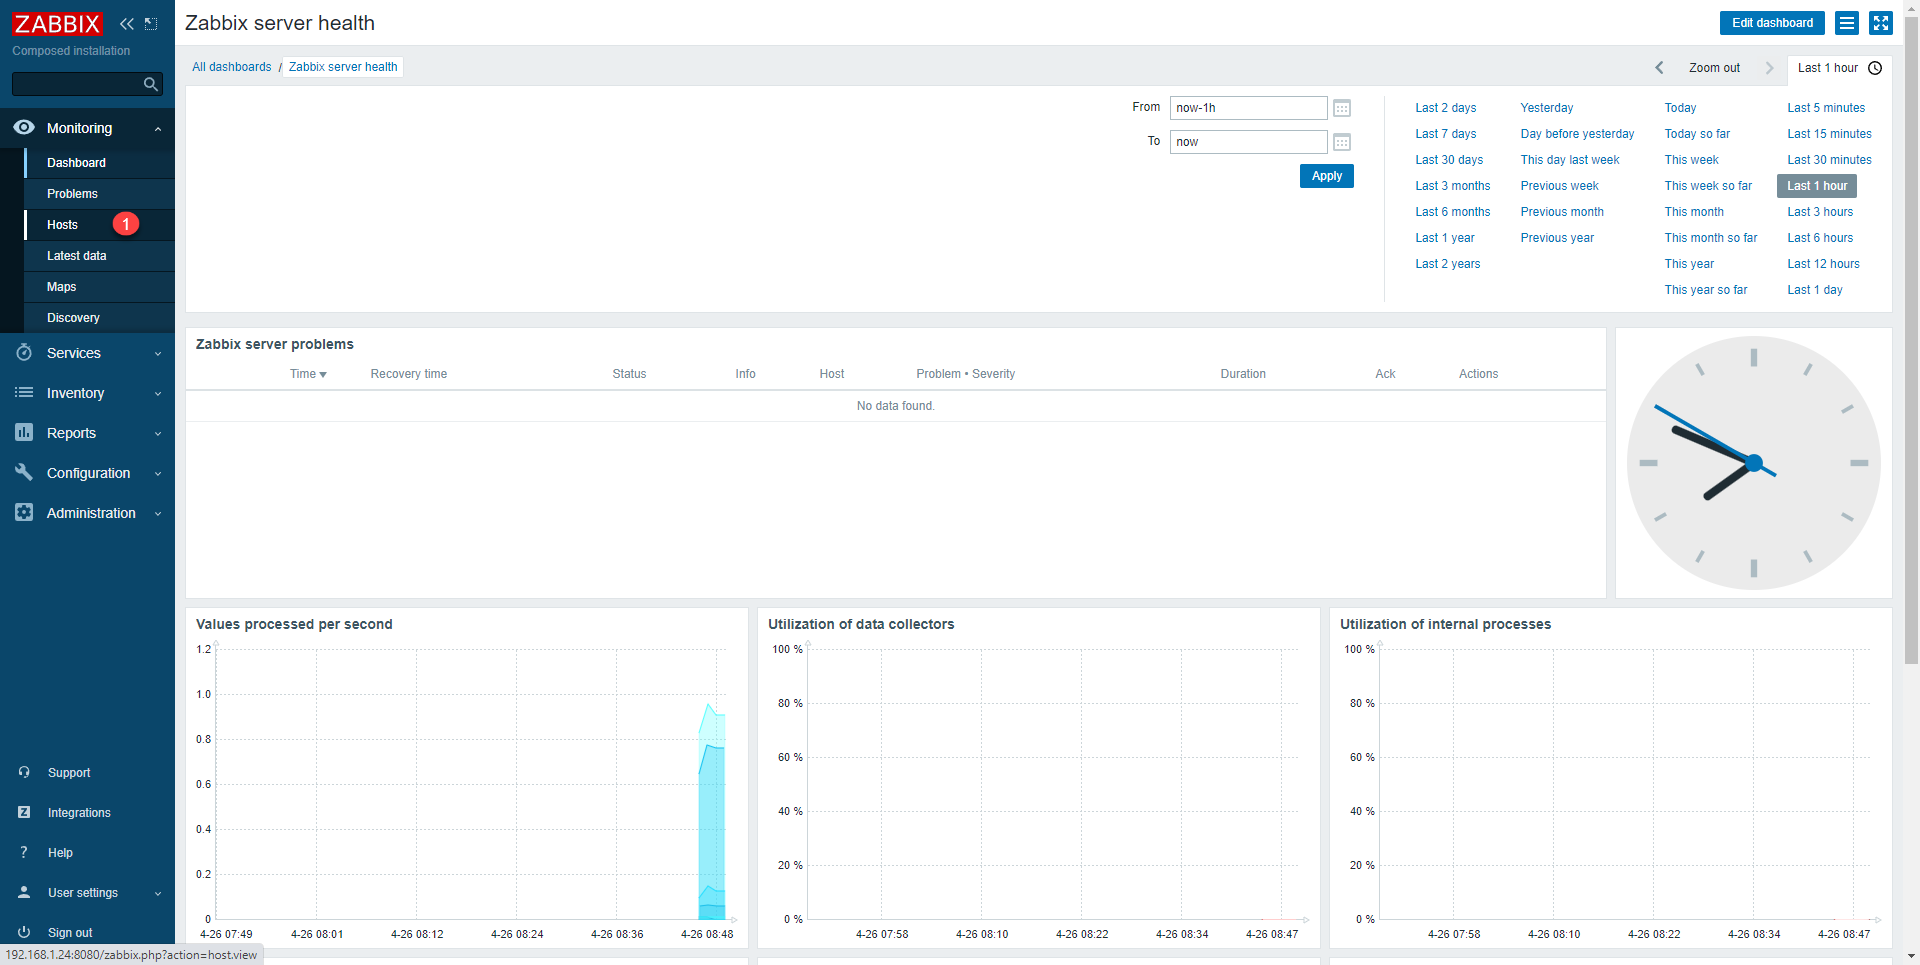
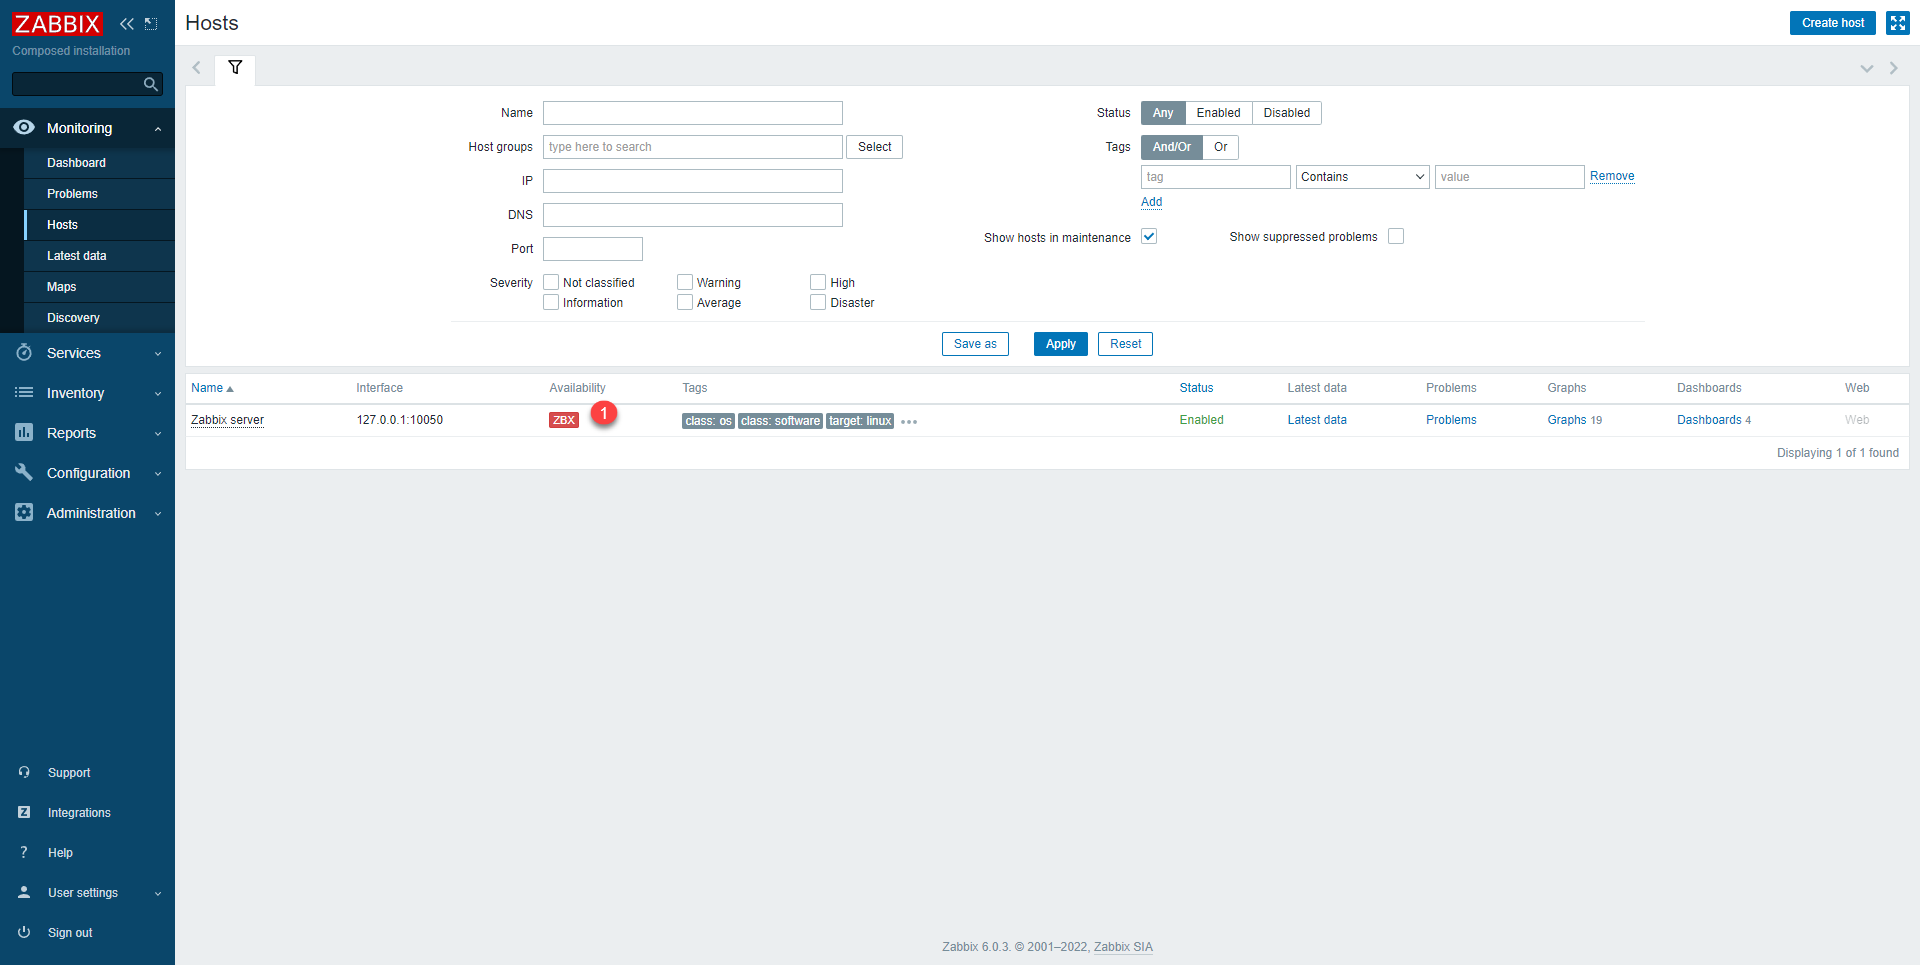
On this page, all the equipment that is supervised by Zabbix is displayed, it is from this list that you can access the different data (metrics) of the supervision and access the graphs and the different dashboards of the equipment. As can be seen below, Zabbix server is red 1.
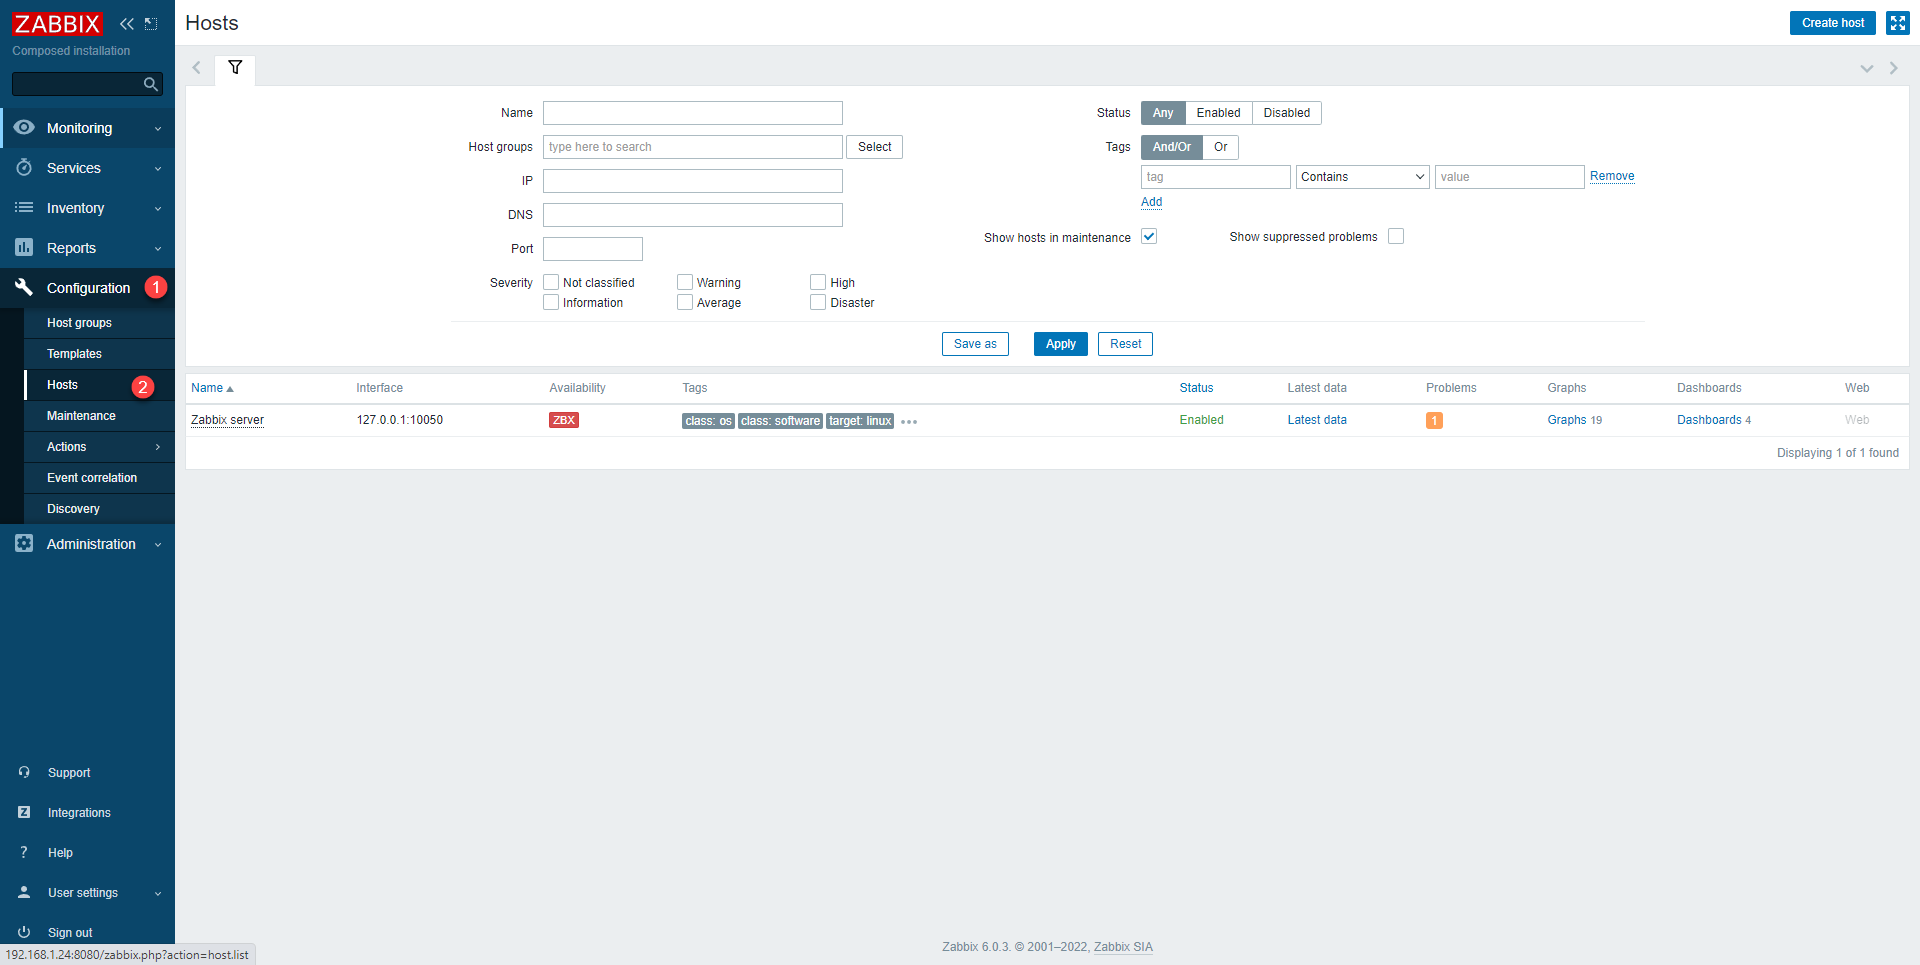
We are going to modify the configuration of the host (agent), from the navigation menu click on Configuration 1 then on Hosts 2.
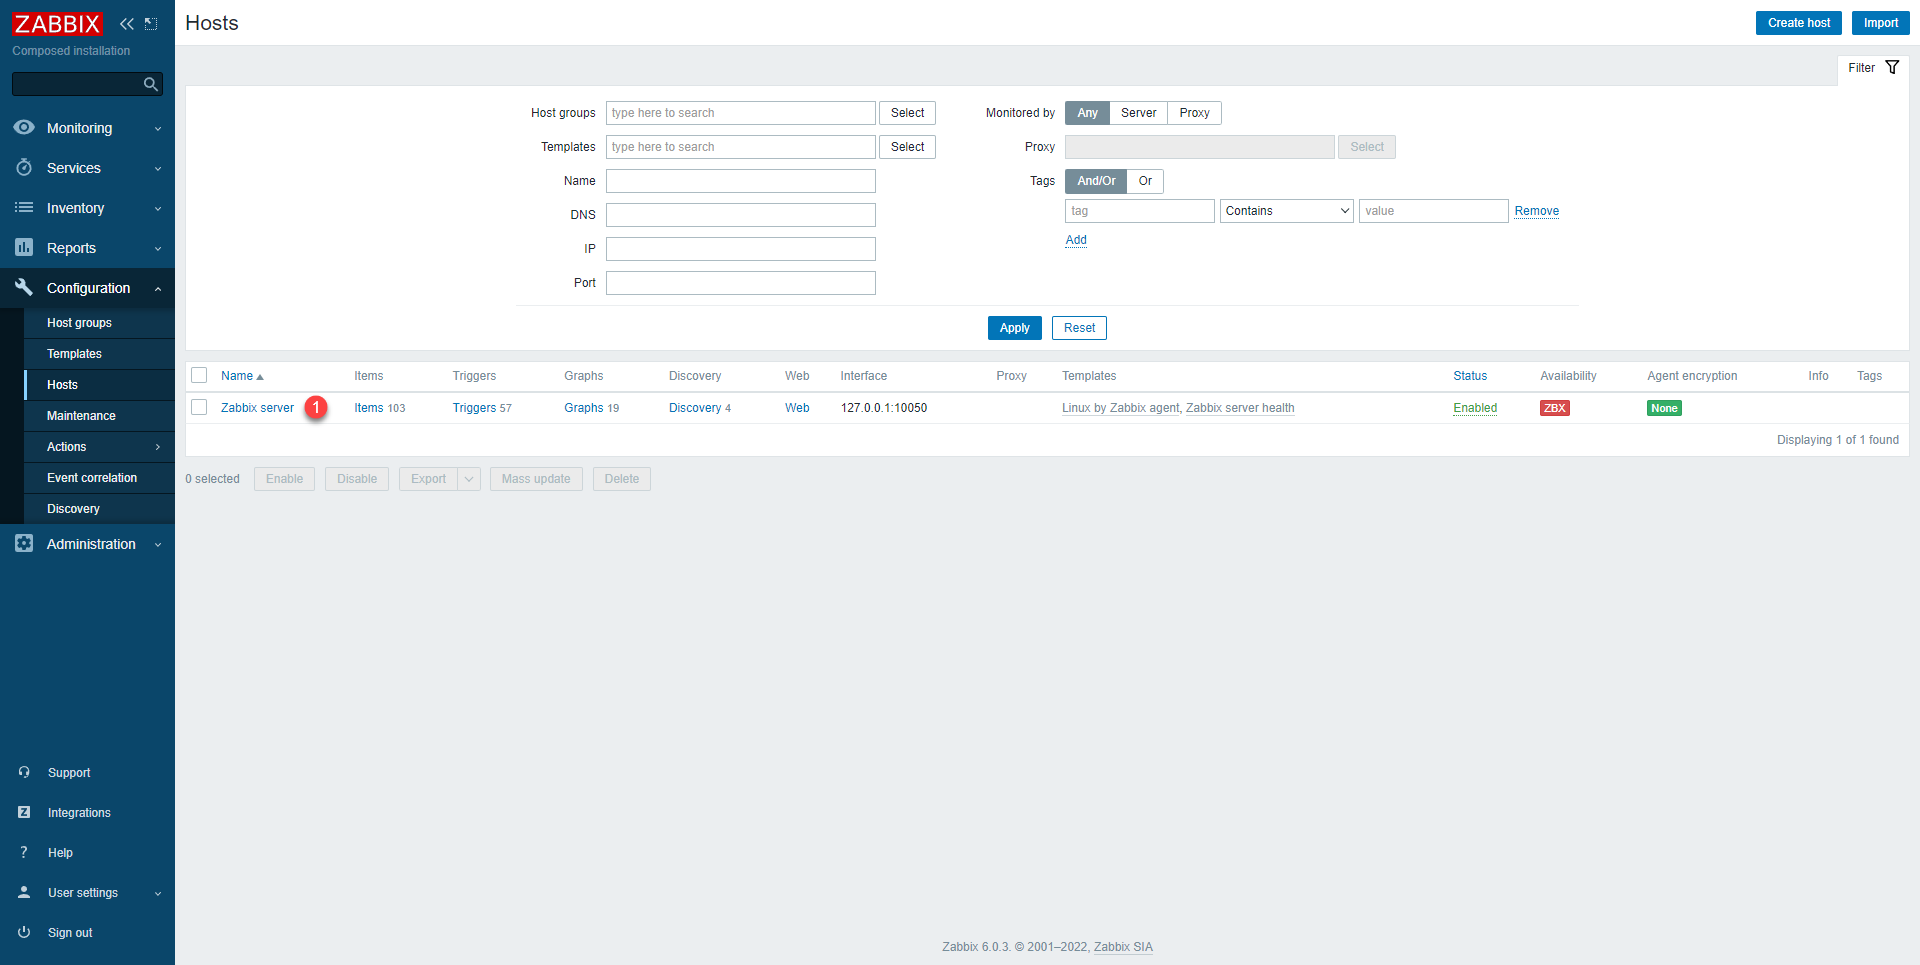
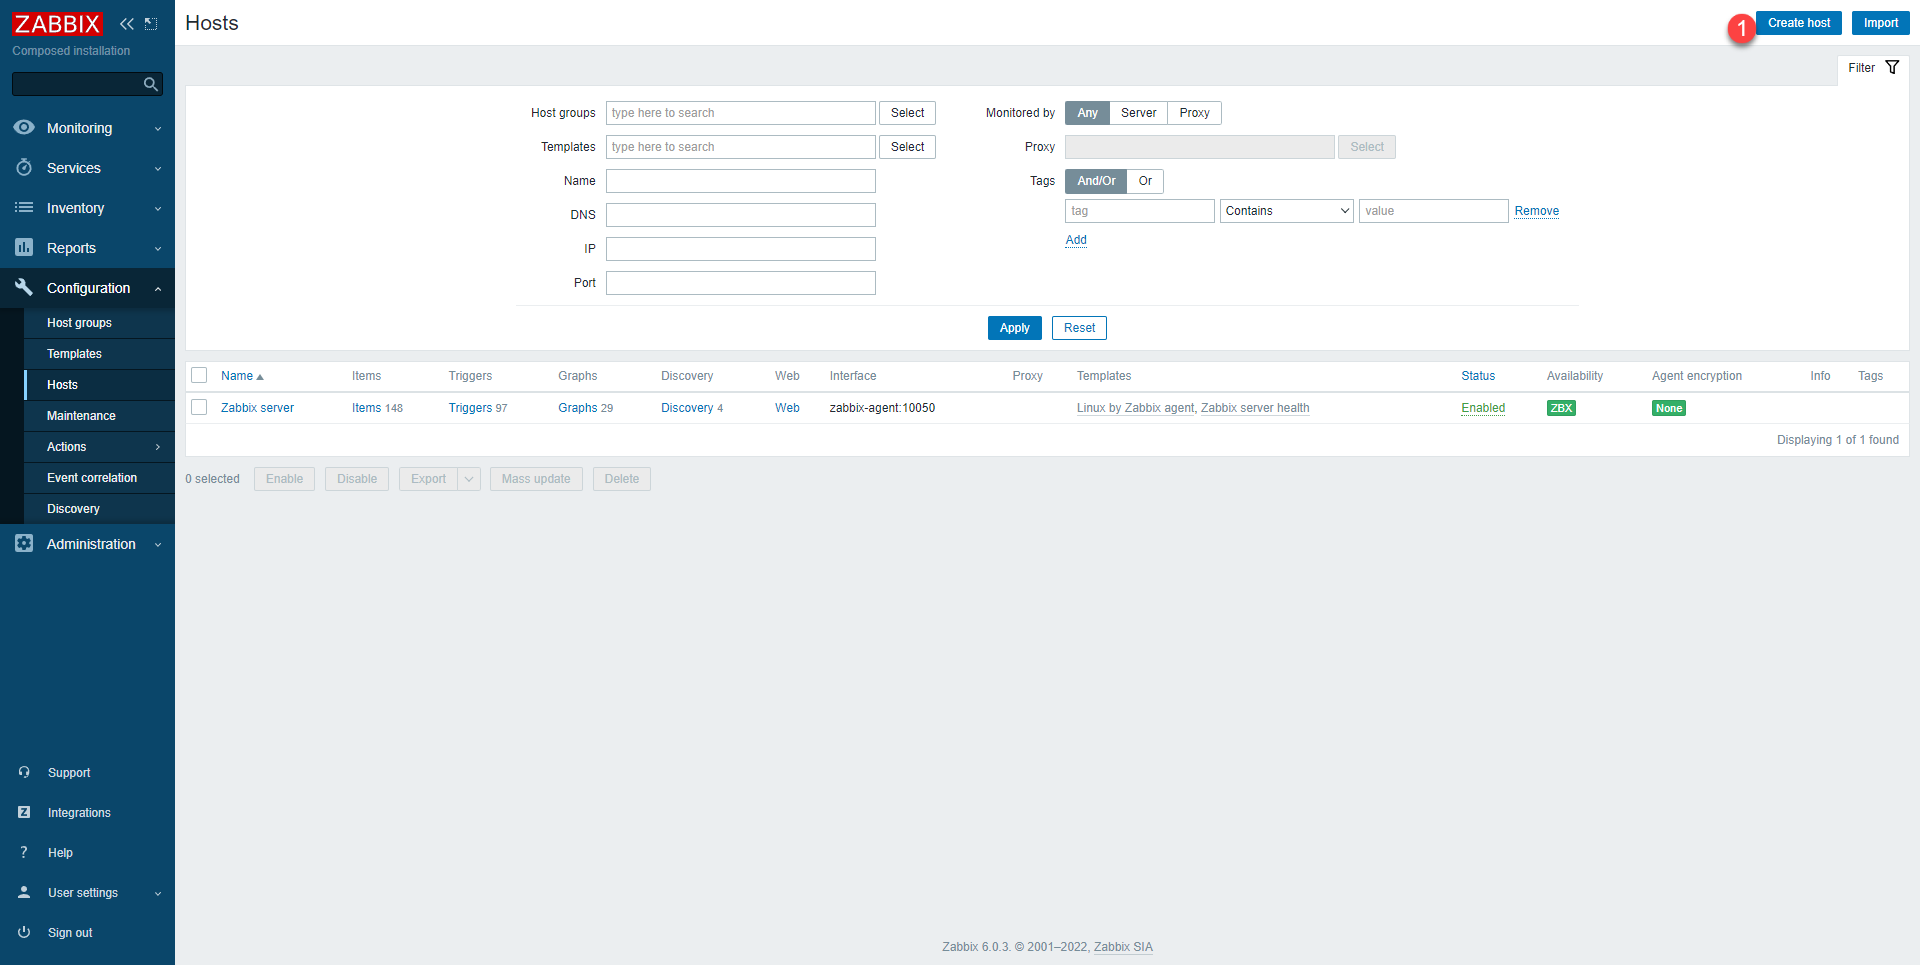
We arrive on a new page, which looks a lot like the previous one, here we also find all the equipment supervised by Zabbix, with the difference that from this one, we configure the equipment (Name, IP addresses, model .. .), we find our Zabbix server, click on it to access the configuration.
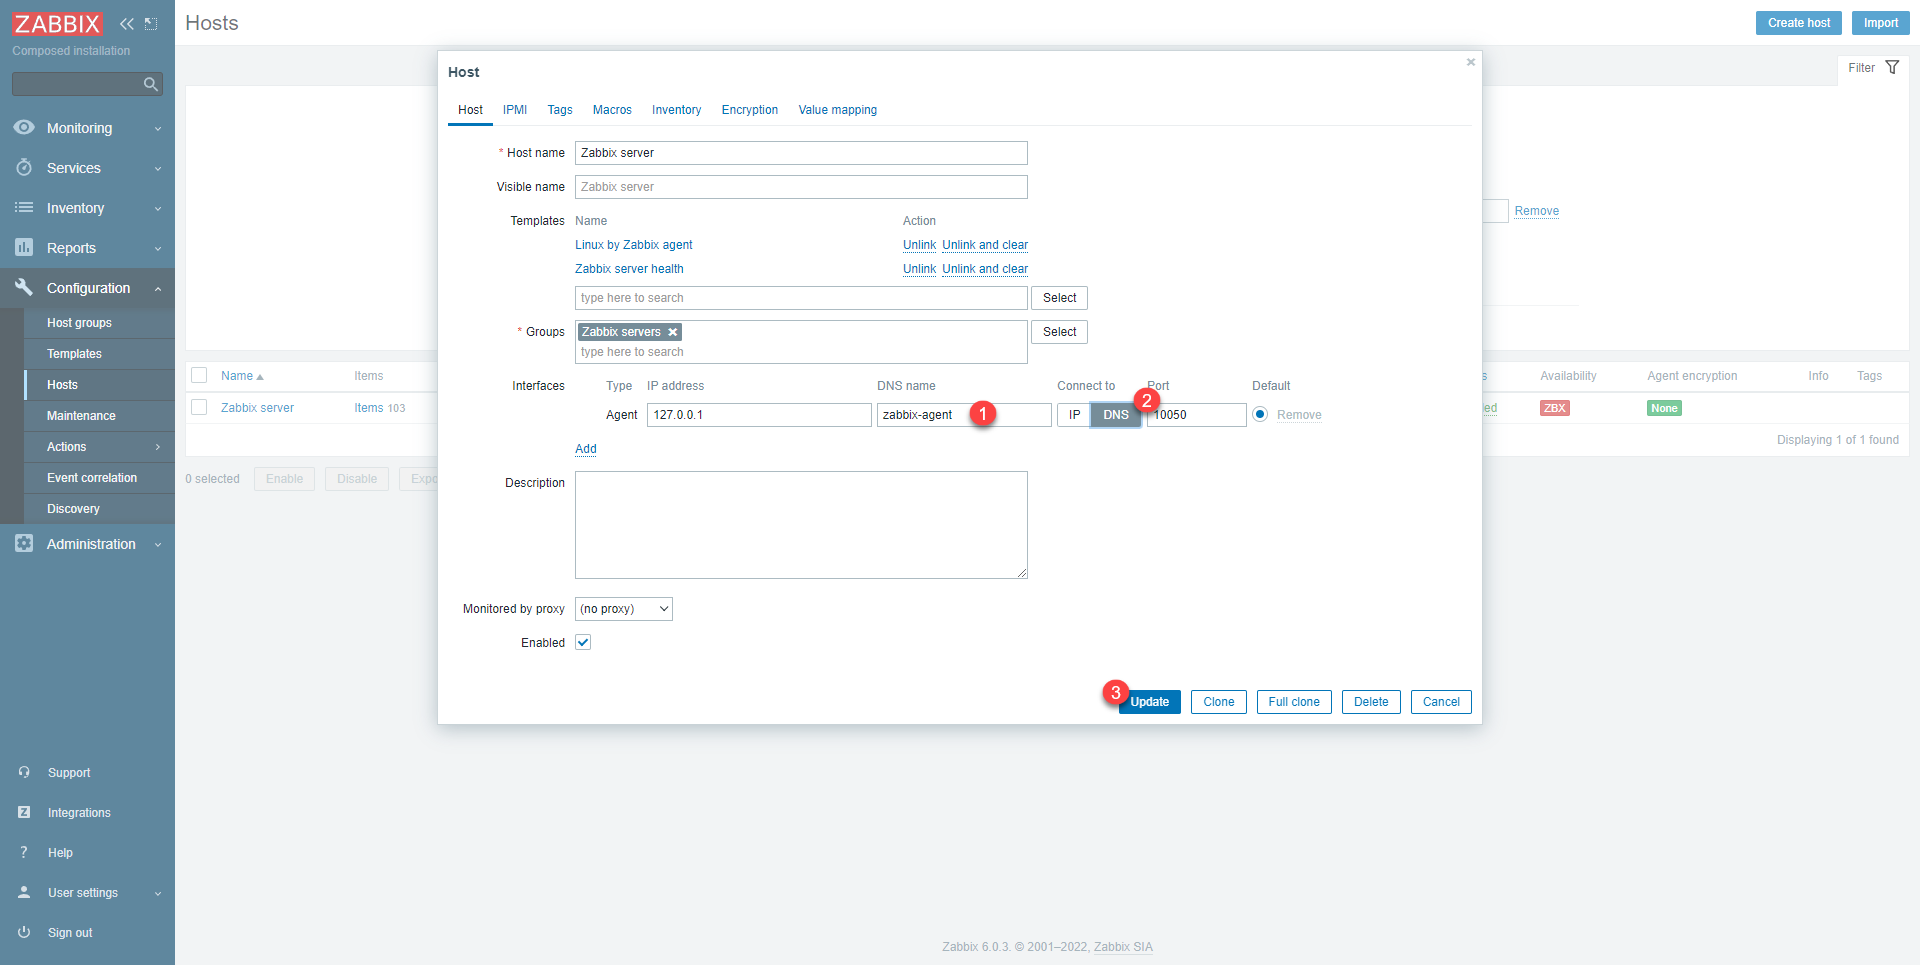
A “modal” window opens with the configuration of the host, the problem here is the IP address of the agent which is in 127.0.0.1, as a reminder we are in containers, and the The address 127.0.0.1 corresponds in this case to the container of the image of the server, to correct this problem, it is necessary to put the name of the container of the agent.
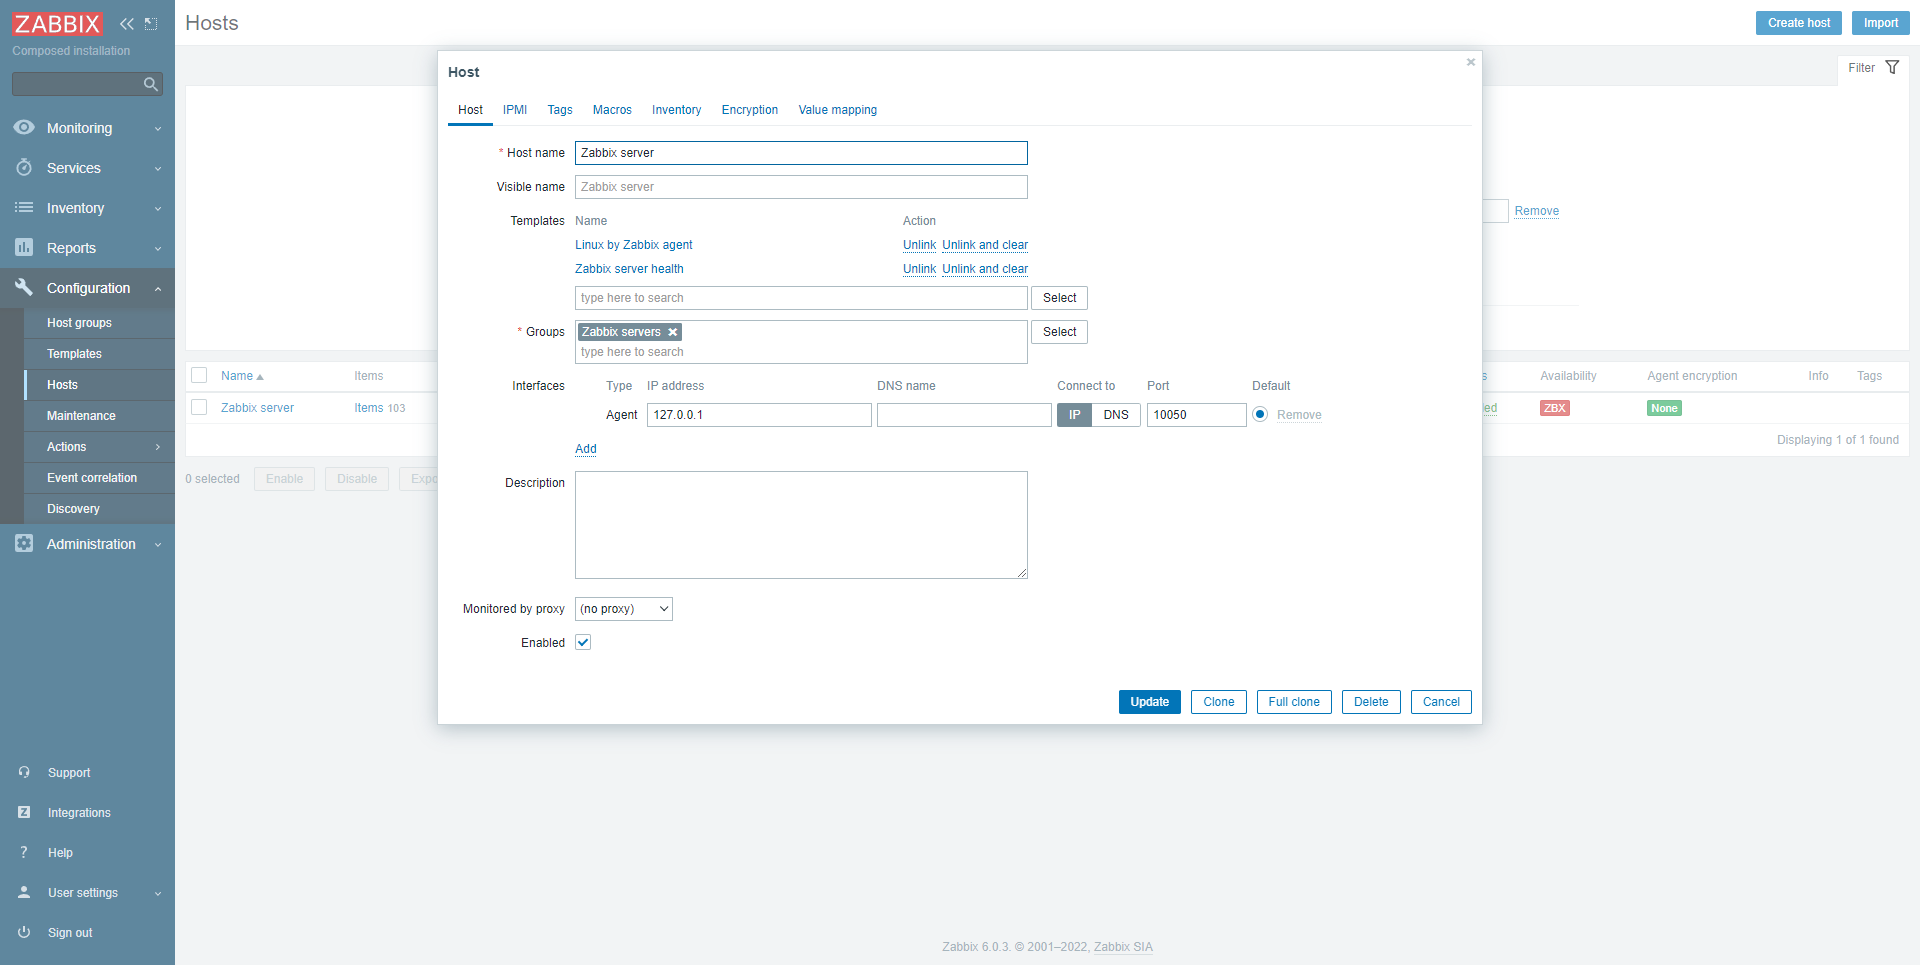
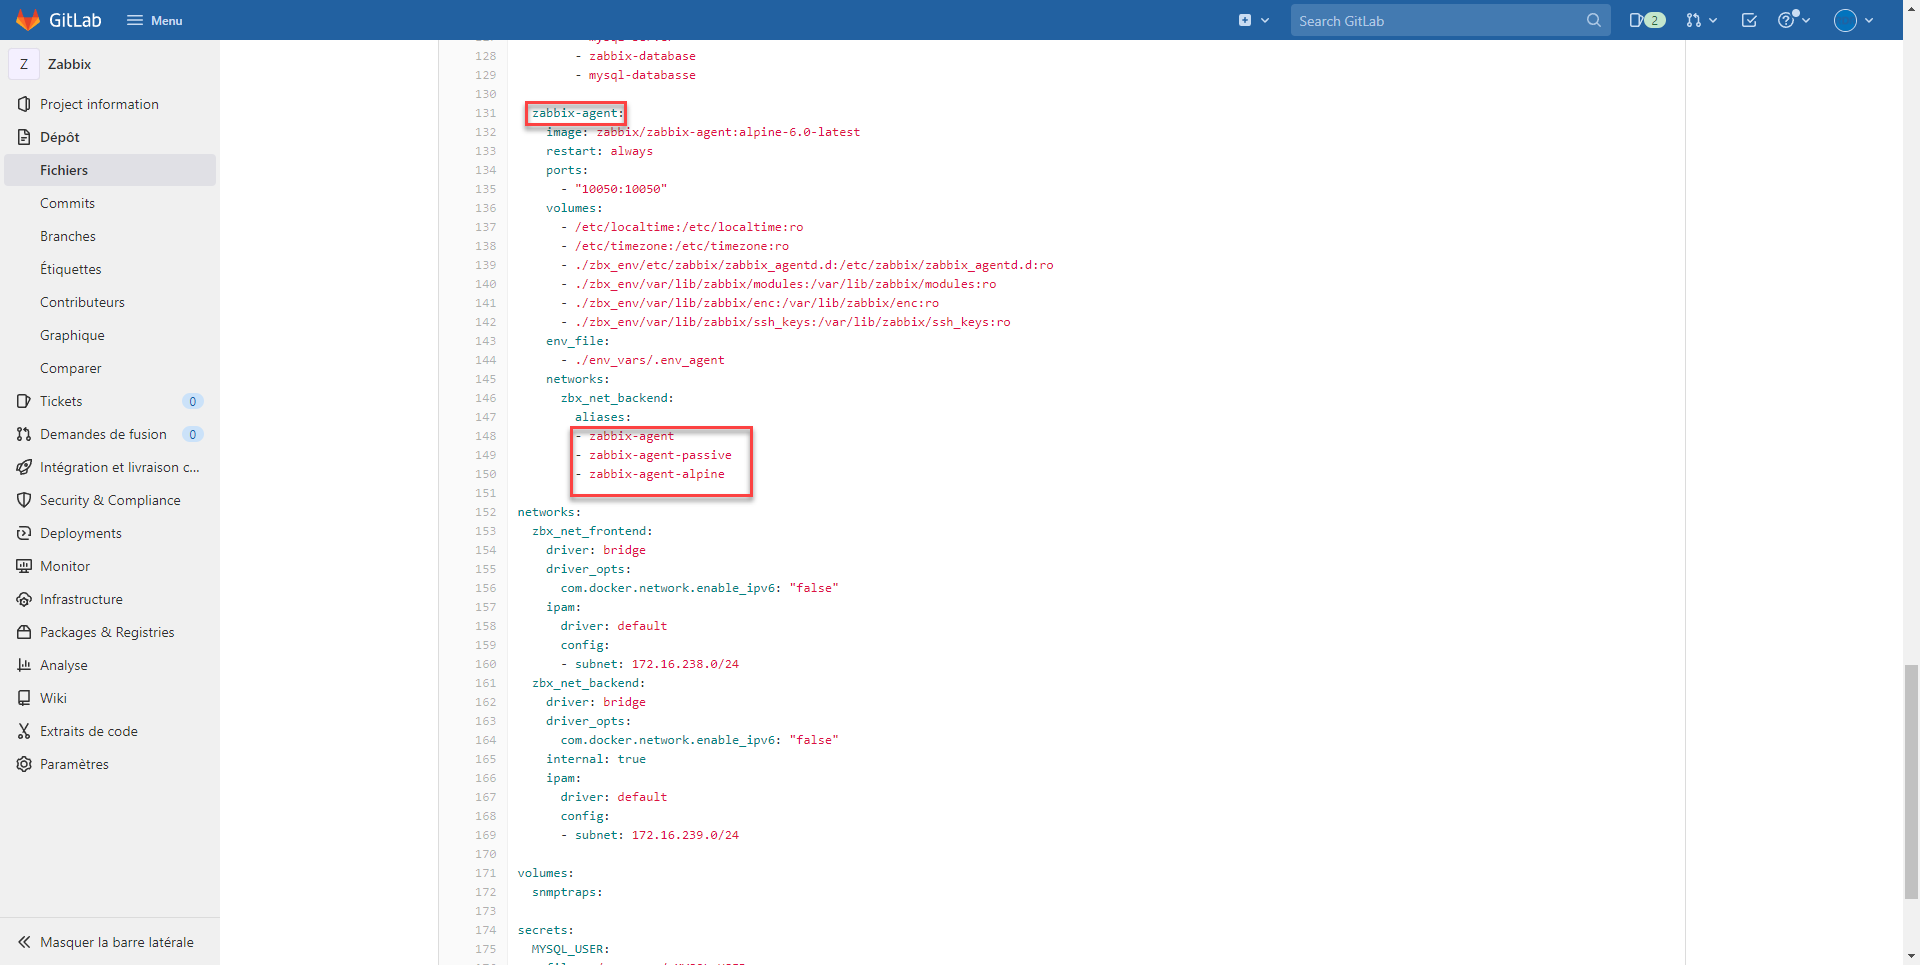
Zabbix agent container name can be found in docker-compose.yml file, on the screenshot below, we see that the name is zabbix-agent and it has aliases.
Enter the DNS name of the agent 1 and select DNS 2 and click on the Update button 3.
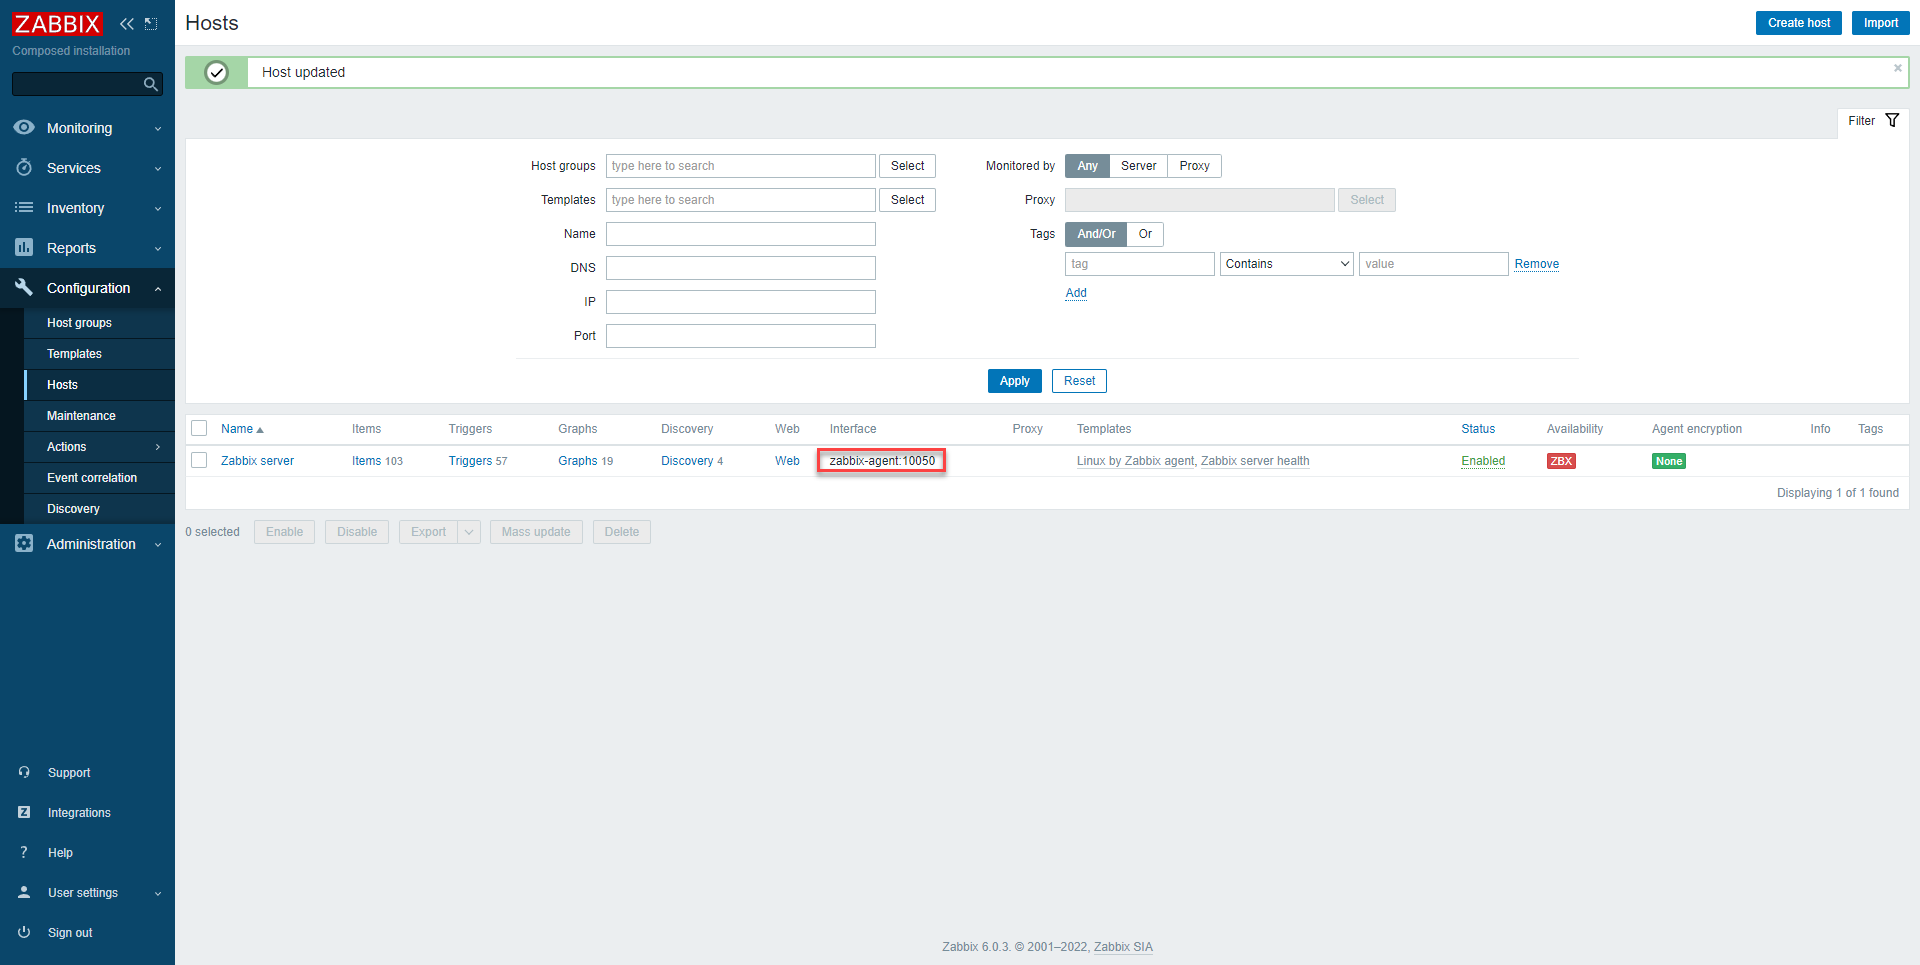
We can see that the configuration of the agent interface is modified, for the moment the agent is still not available.
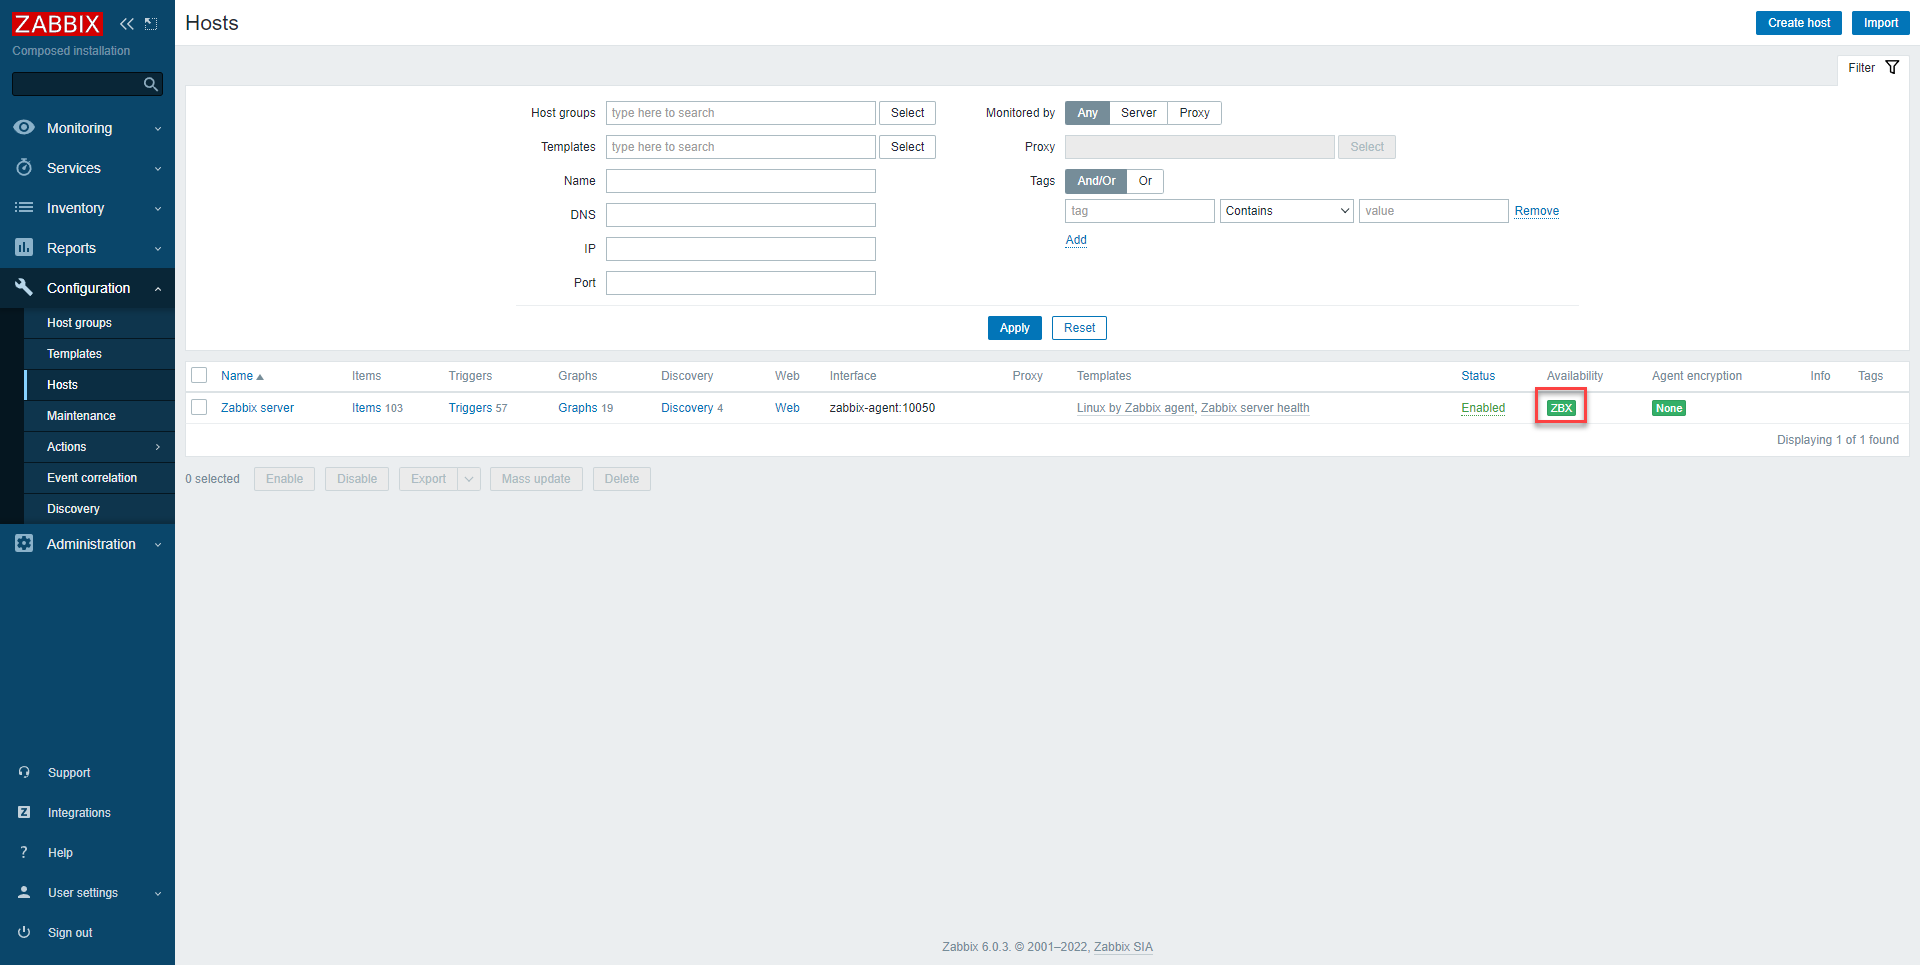
Wait 5 minutes, normally the Zabbix server host should be available as in the screenshot below:
In the Monitoring part, it’s good too:
If we go back to the dashboard, it should have evolved with more information in terms of graphics.
This manipulation should normally start to familiarize you with Zabbix.
Monitor Windows and Linux servers with Zabbix agent
We will now see how to monitor Windows and Linux servers with Zabbix 2 agent.
In this tutorial, I will use agent 2, which is a version written in Go that offers more possibilities
I will also configure the agents in active mode (more on why later).
In this part, we will first see the installation of the agent on Ubuntu and then on Windows, once the agent is installed, we will see how to add the hosts in Zabbix, this part is the same for Linux or Windows, it is necessary choose the right model.
Installing and configuring Zabbix agent on Ubuntu
To install the agent on Ubuntu / Debian, you must first download a package (deb) which will add the repository to the machine and then do a “classic” installation of the package.
For Ubuntu you will find the package here : https://repo.zabbix.com/zabbix/6.0/ubuntu/pool/main/z/zabbix-release/
Copier le lien du package correspondant à votre distribution et à sa version, cliquer droit sur lien puis copier le lien.
In the terminal of your machine, enter the command below to download the package:
wget https://repo.zabbix.com/zabbix/6.0/ubuntu/pool/main/z/zabbix-release/zabbix-release_6.0-1%2Bubuntu20.04_all.debOnce downloaded, install the package:
sudo dpkg -i zabbix-release_6.0-1+ubuntu20.04_all.debUpdate package list:
sudo apt updateIn the console, you should see querying the Zabbix repository.
We will now install Zabbix agent 2:
sudo apt install zabbix-agent2 -y
Now that the agent is installed, it must be configured, for this you must edit the file /etc/zabbix/zabbix_agent2.conf
sudo nano /etc/zabbix/zabbix_agent2.confEdit the following parameters:
Server=127.0.0.1Replace the IP address with the Zabbix server IP address or its DNS name.
ServerActive=127.0.0.1Replace the IP address with the Zabbix server IP address or its DNS name.
Hostname=Zabbix serverReplace Zabbix server with the name of the device (server name), this will be used to configure the host in Zabbix.
The changes made, save the file.
Enable agent service:
sudo systemctl enable zabbix-agent2Finish by starting the service:
sudo systemctl start zabbix-agent2The agent is installed.
You can check the agent status using the following command:
sudo systemctl status zabbix-agent2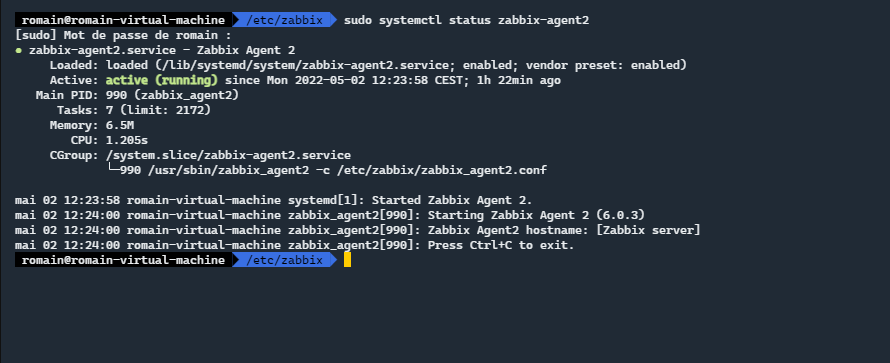
Installation and configuration of Zabbix agent on Windows
Download Zabbix agent for Windows at this address: https://www.zabbix.com/fr/download_agents
For this tutorial, I will continue with agent version 2.
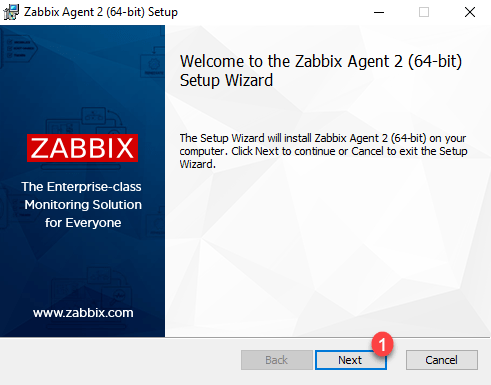
Run the download file.
When the wizard is launched, click on Next 1.
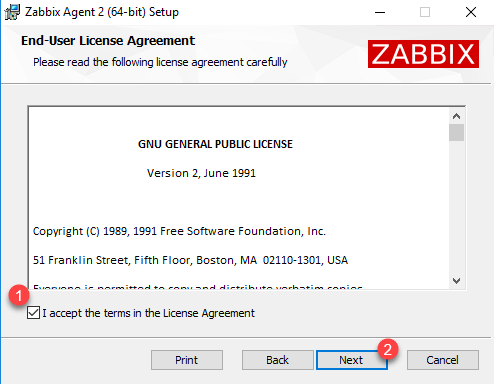
Accept the license 1 and click on Next 2.
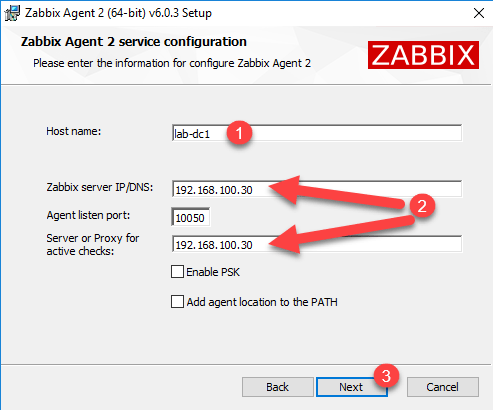
Enter host name 1> for binding with Zabbix, then enter DNS name or IP of Zabbix server 2 and click Next 3.
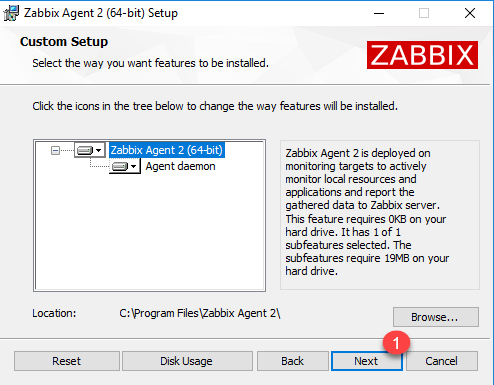
When customizing the installation, click on Next 1.
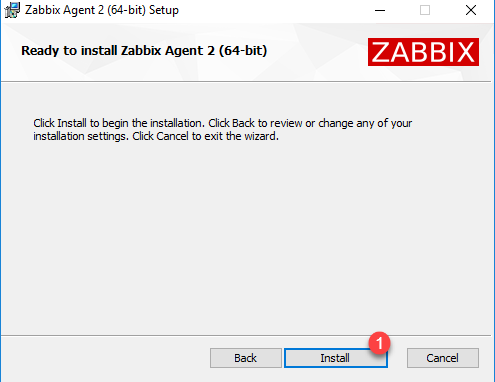
Confirm the installation by clicking on the Install 1 button.
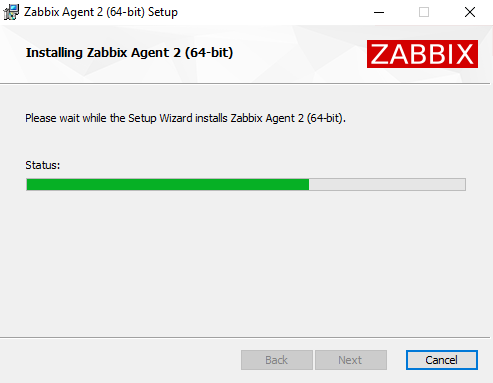
Wait while installing…
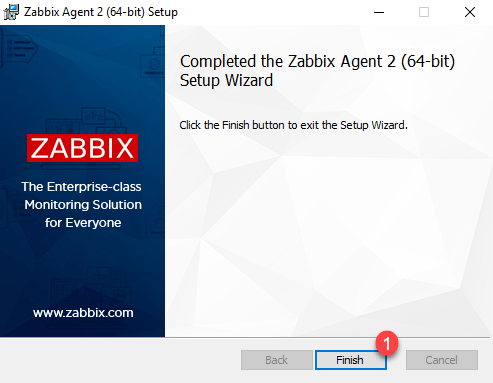
When the installation is complete, close the wizard by clicking on Finish 1.
If you need to modify the agent configuration, you must edit the file: zabbix_agent2.conf located in the folder: C:\Program Files\Zabbix Agent 2
For the changes to take effect, you must restart the Windows service: Restart-Service ‘Zabbix Agent 2’
Add server in Zabbix
Now that we have installed the Zabbix agents, we will see how to add them to the server to get monitoring information.
Return to Zabbix web interface.
In the navigation menu, expand Configuration 1 and click on Hosts 2.
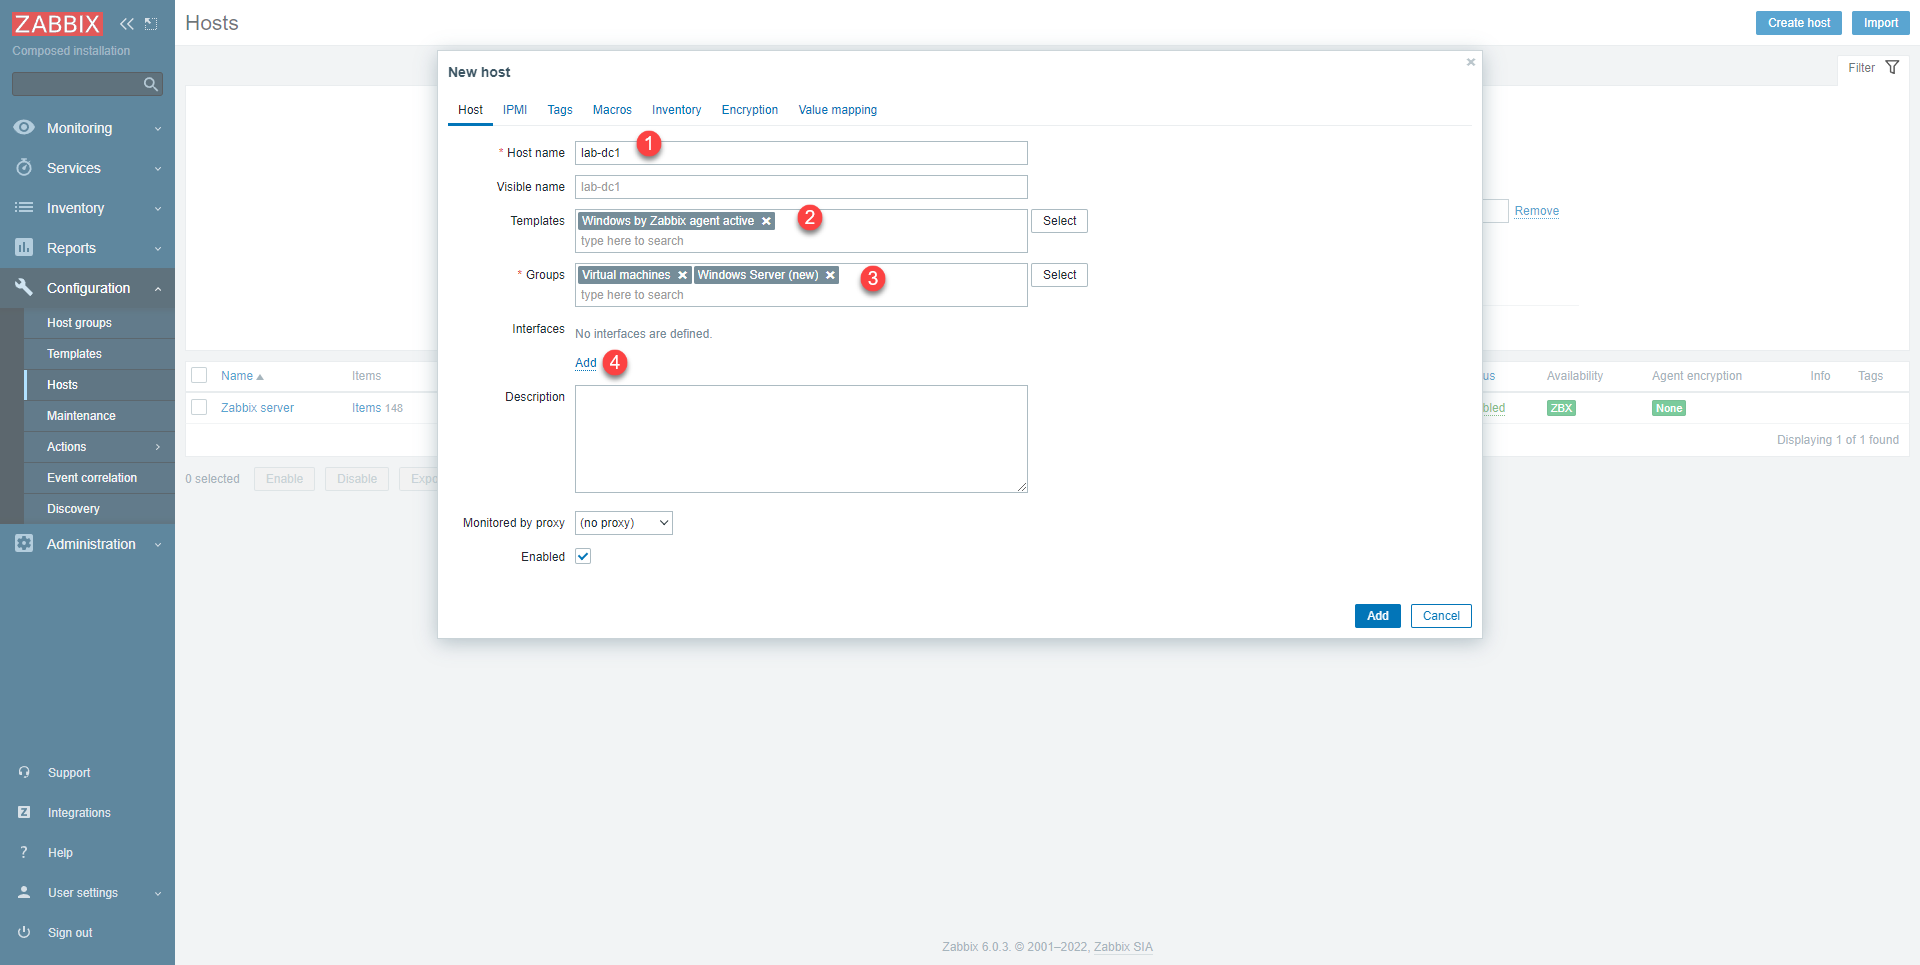
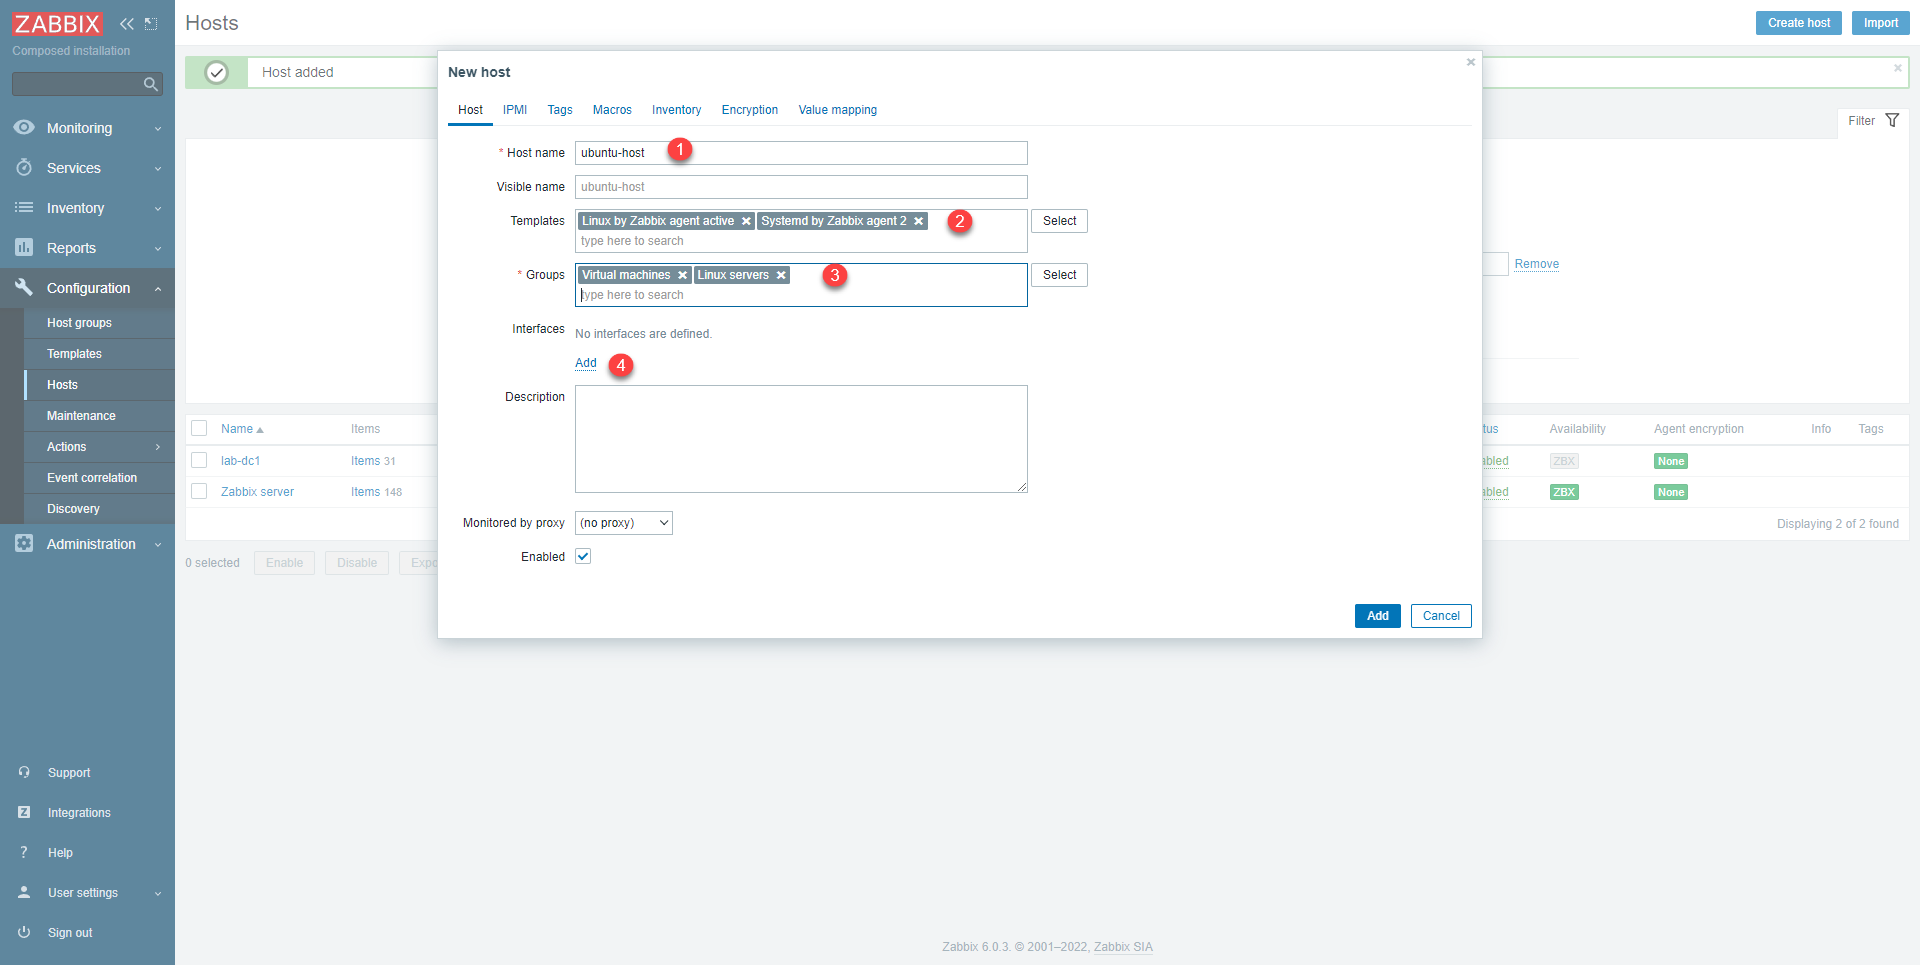
On the list of hosts, click on the Create host 1 button, which is located at the top right.
Enter the name of the host 1 as defined in the configuration file, select the template(s) 2 which will determine the elements to monitor, select at least one group 3 and click on Add 4.
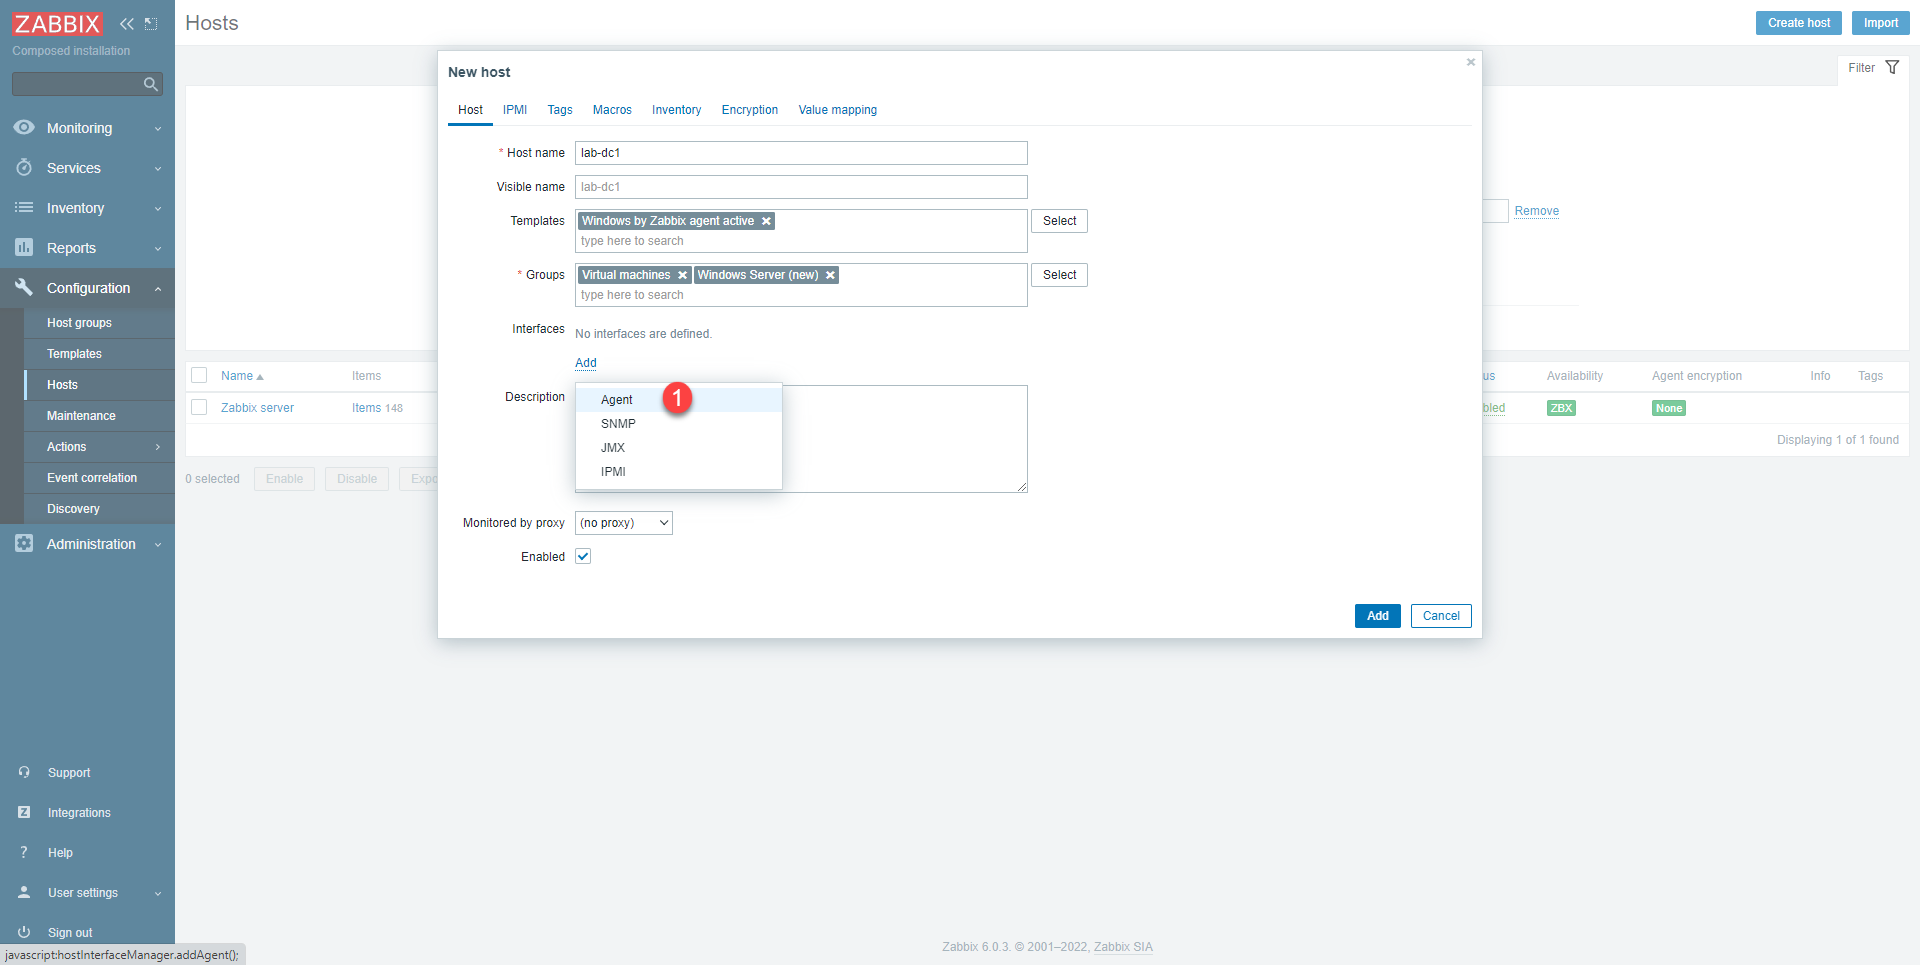
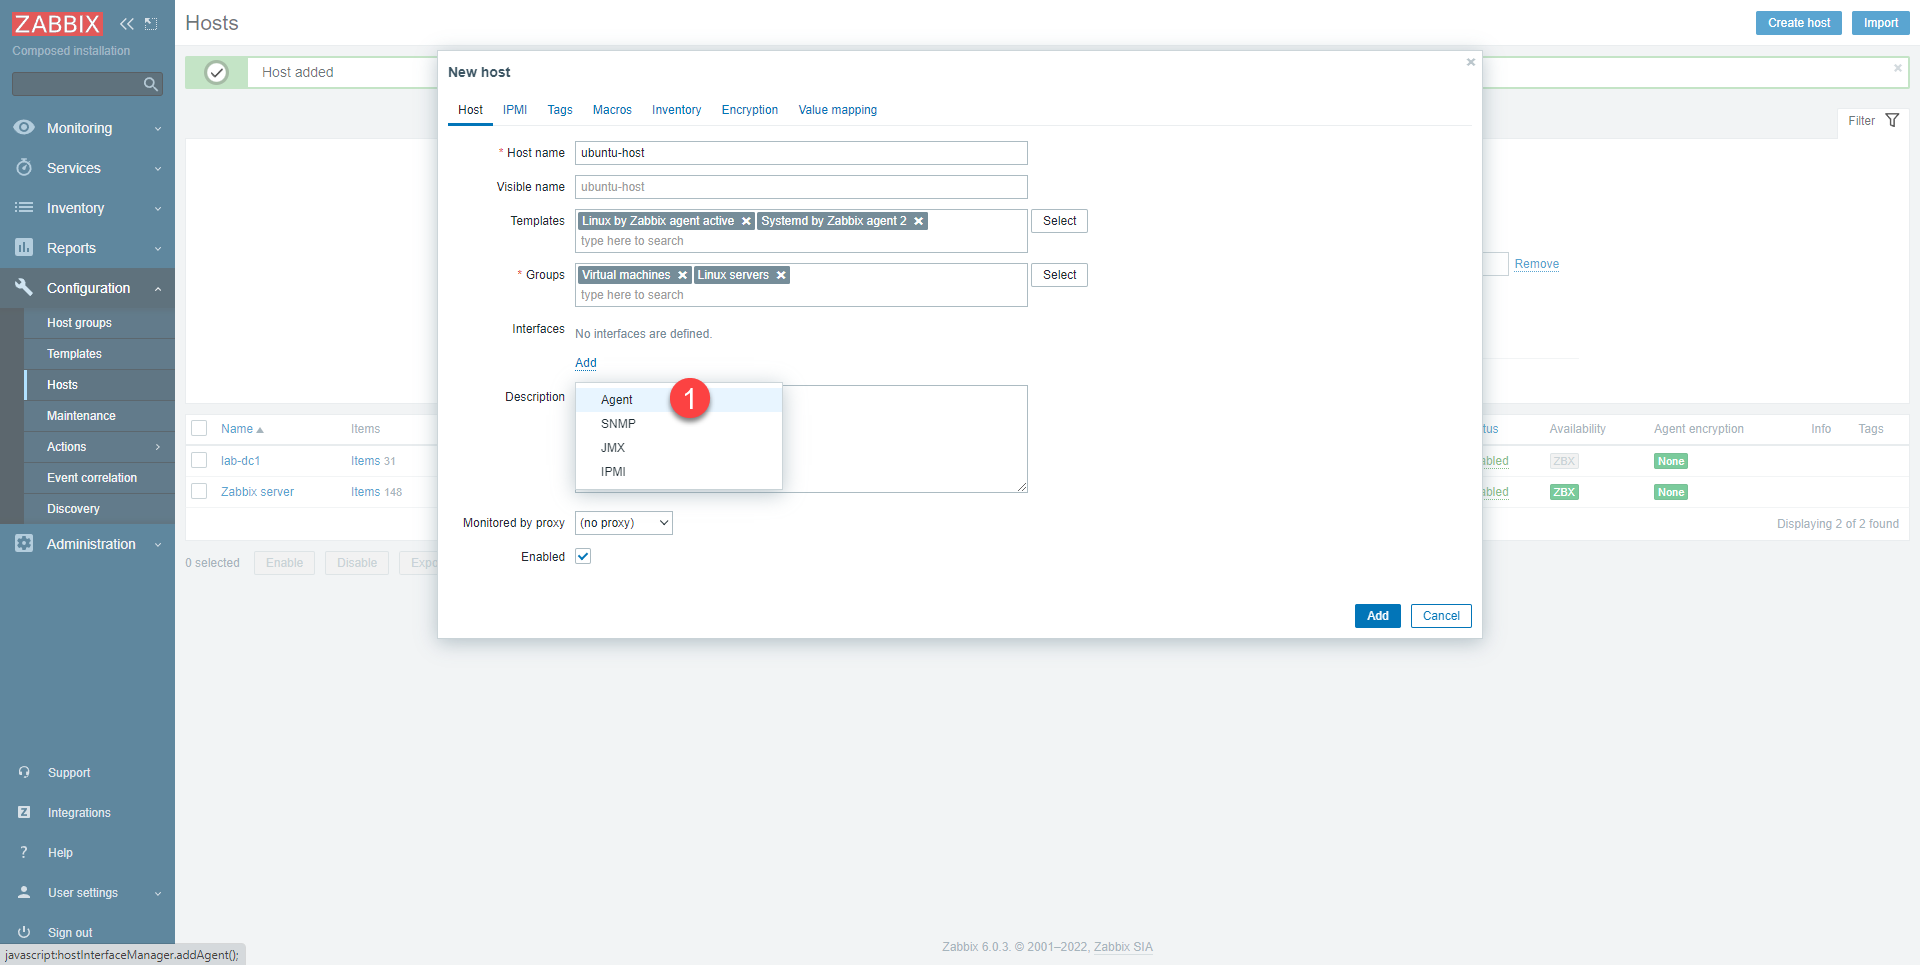
Select how the equipment will be supervised, here by the agent, click on Agent 1.
Enter the IP address of the computer 1 and finish by clicking on the Add button 2 to add the host.

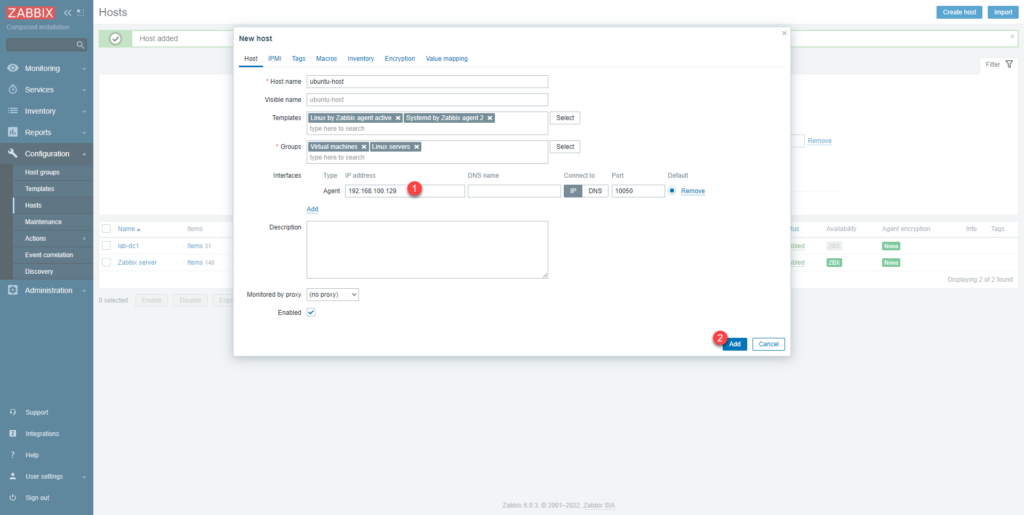
Hosts are added:
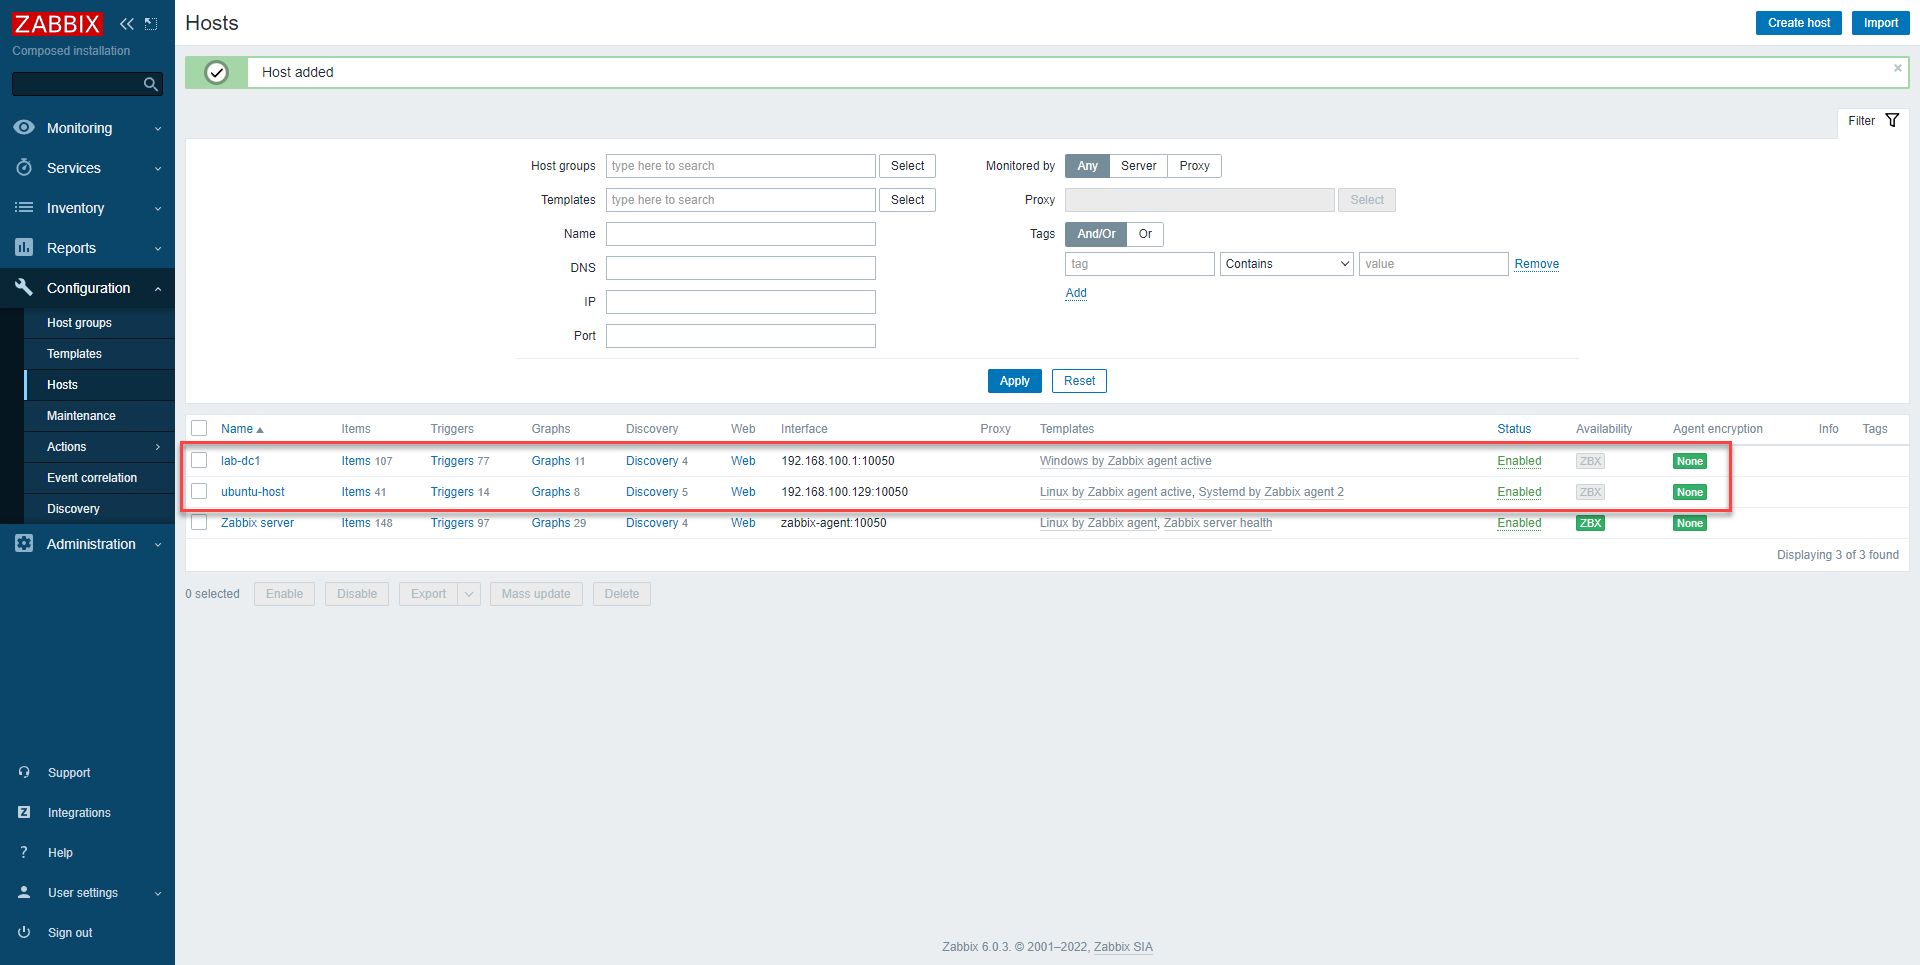
Some explanations to understand the different elements:
- Items : corresponds to the different supervised elements (cpu, ram, network card, services …), the number varies from one server to another depending on the elements
- Triggers : these are the triggers of the various “problems” which are linked to the items (low disk space, service stops…).
- Graph : graph linked to item
- Discovery : contains different tasks that will allow you to discover the Items to be monitored (discovery of services on hosts, discovery of hard disks, etc.)
The same host list after a few minutes, we can see the number of ubuntu-host host items increased to 388.
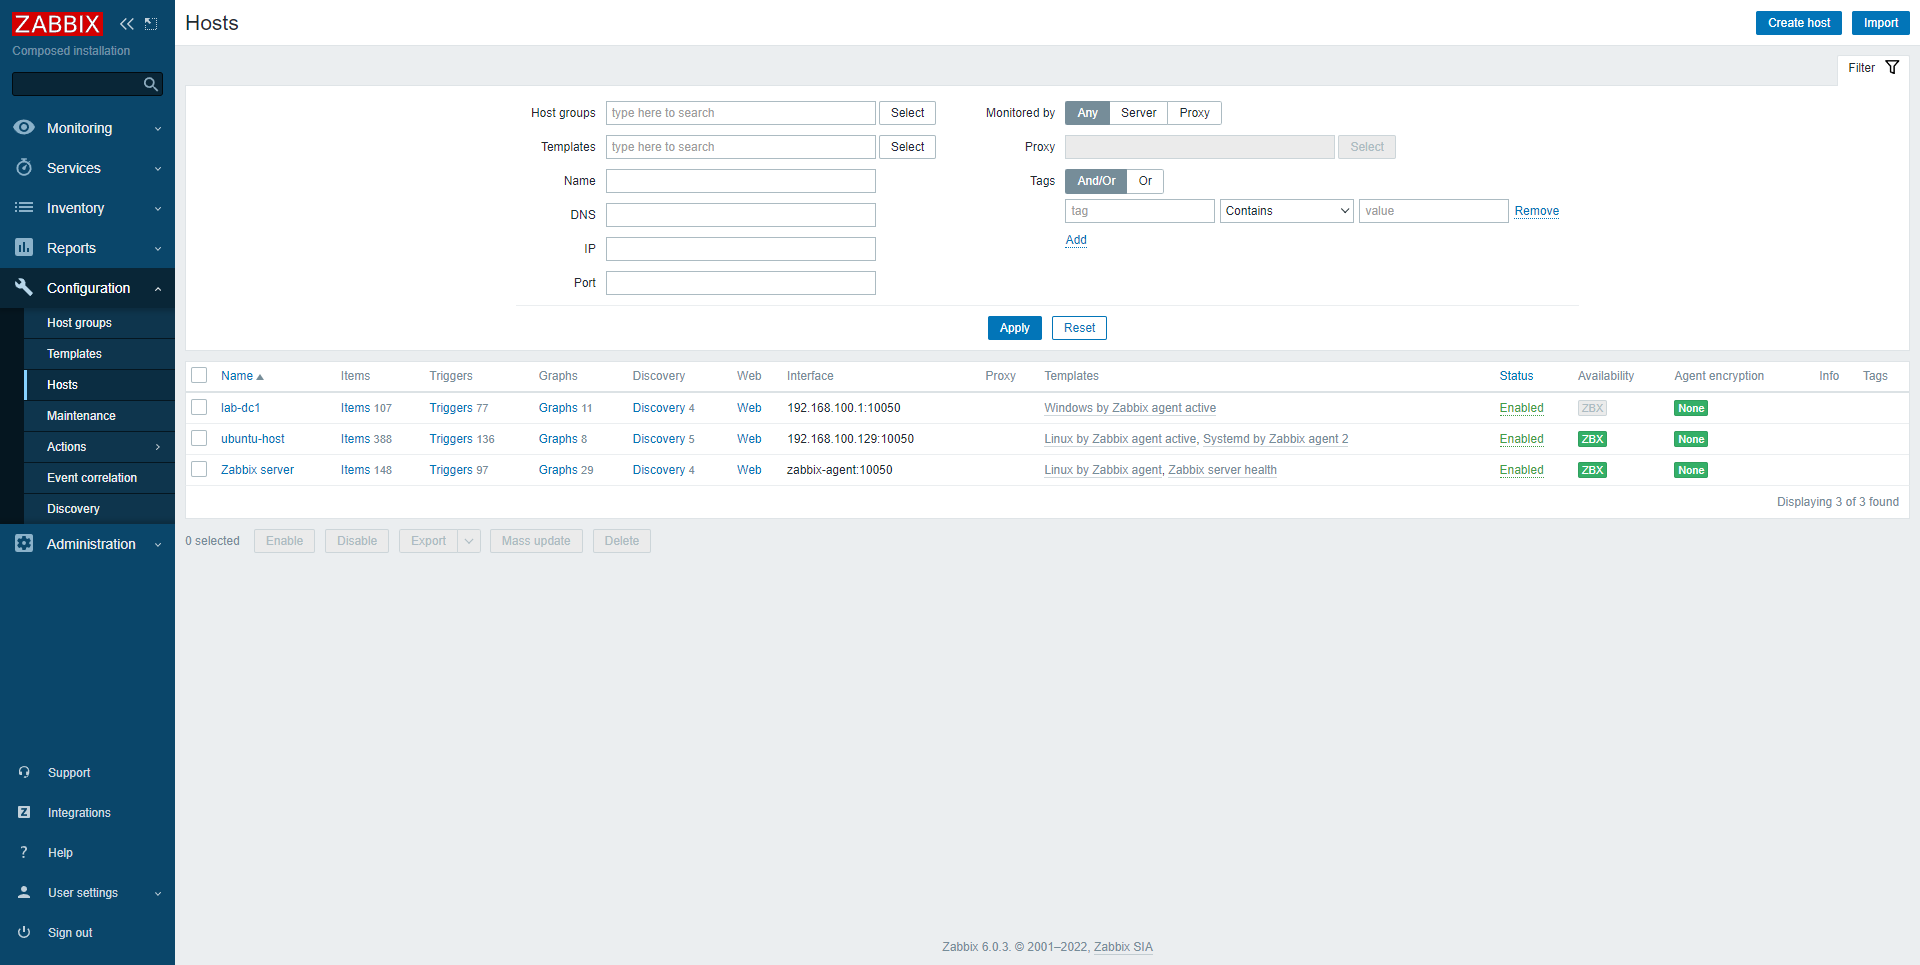
Now you know how to monitor servers with Zabbix agent.
To add Items, look in the templates which offers a lot of things by default like: IIS, Nginx, Docker …
View host monitoring
Now I will explain how to see the data of the hosts that have been added.
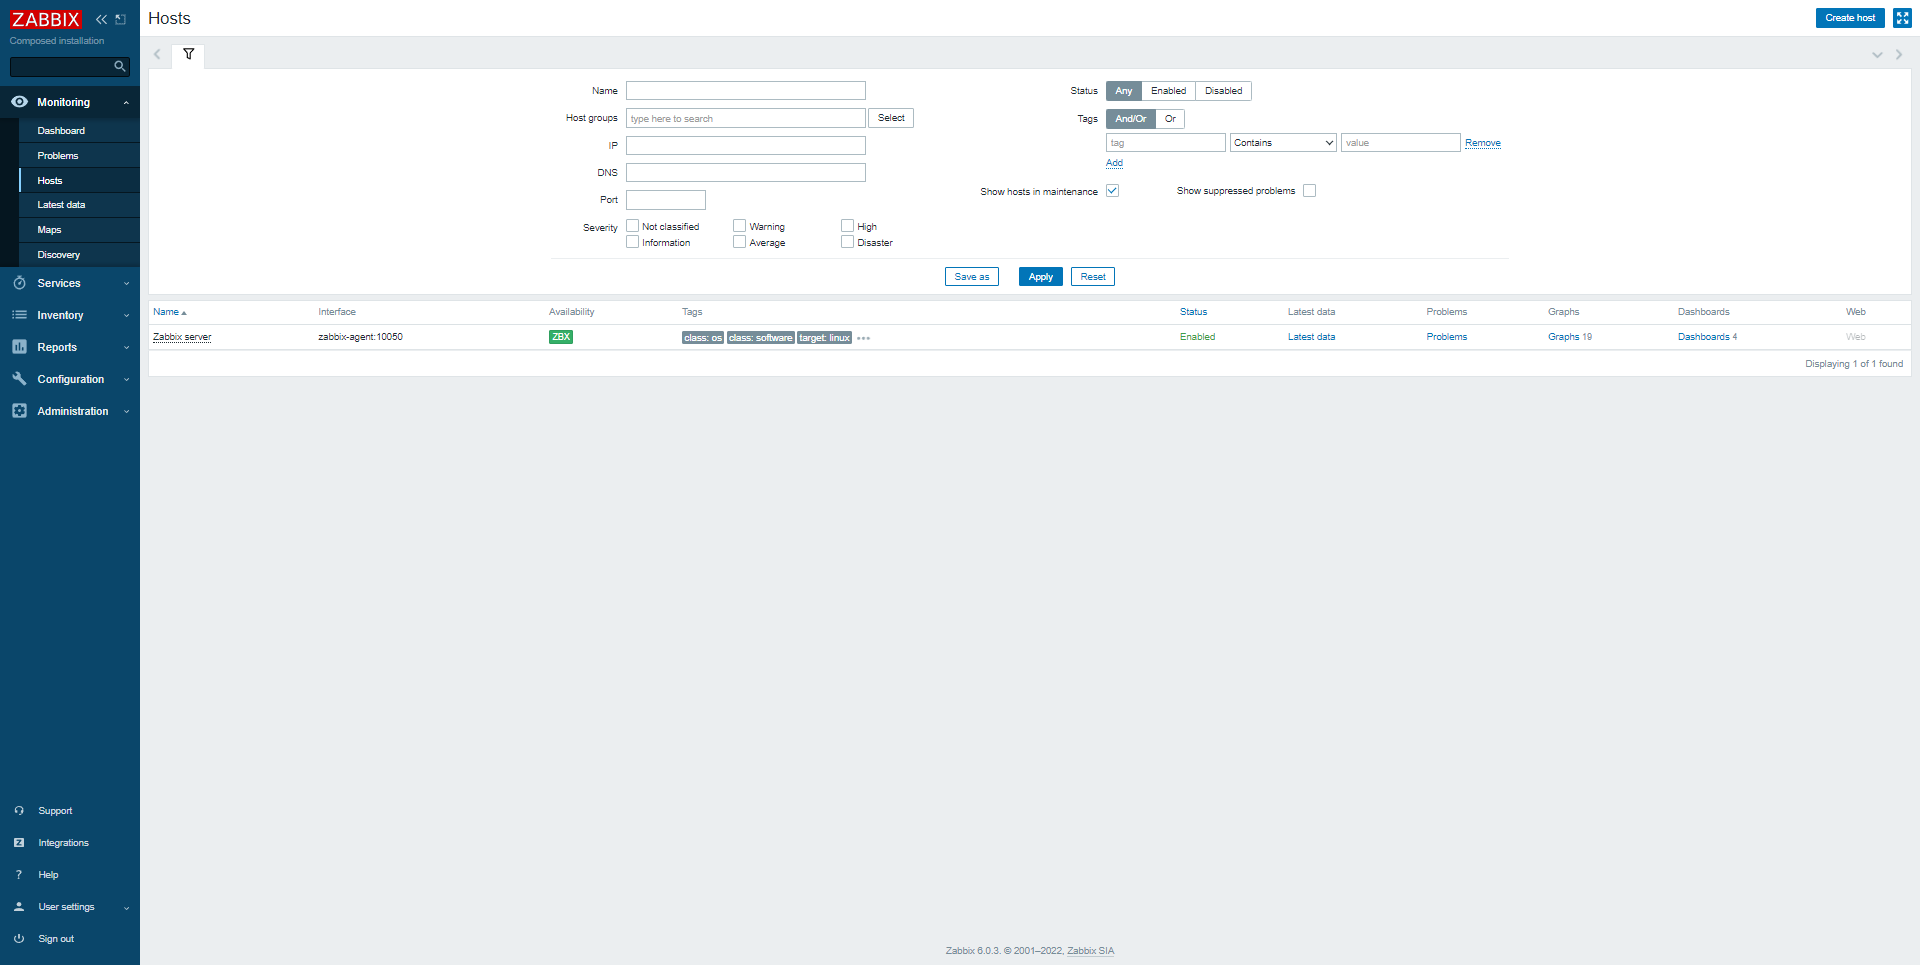
In the menu, expand Monitoring 1 and click on Hosts 2.
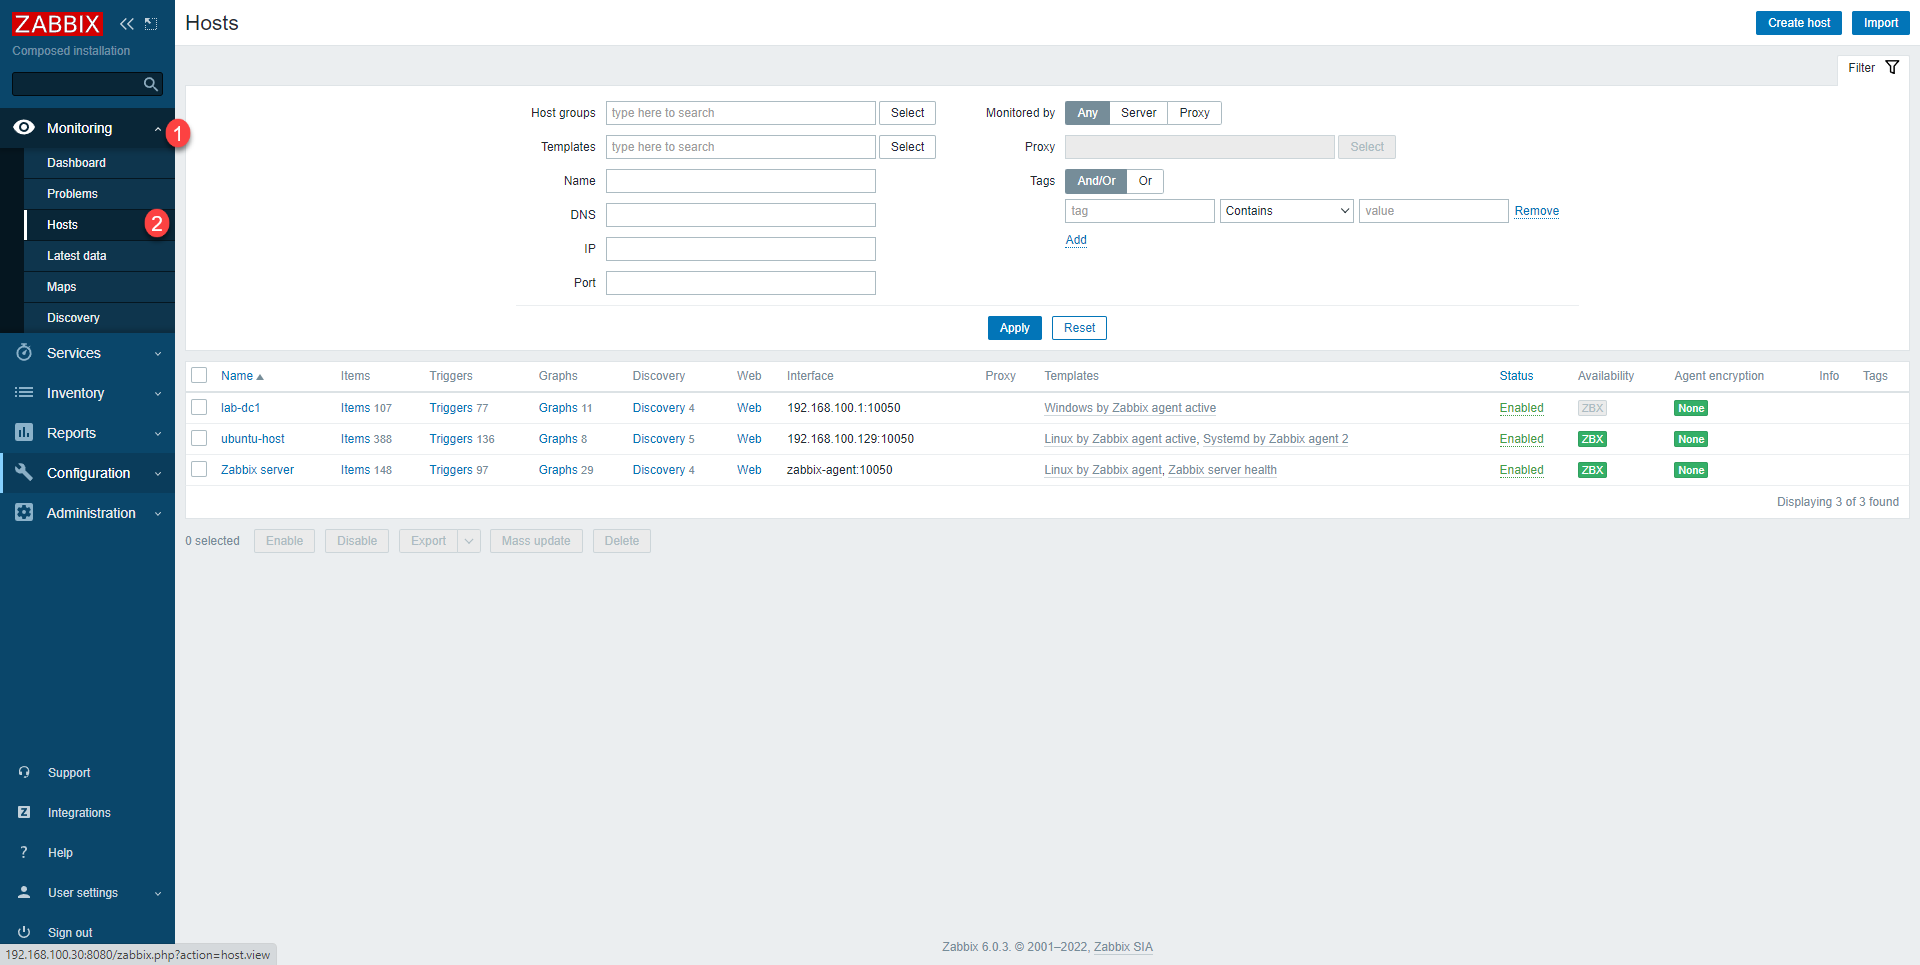
We arrive on a page, which also displays the list of hosts, this one displays the monitoring data.
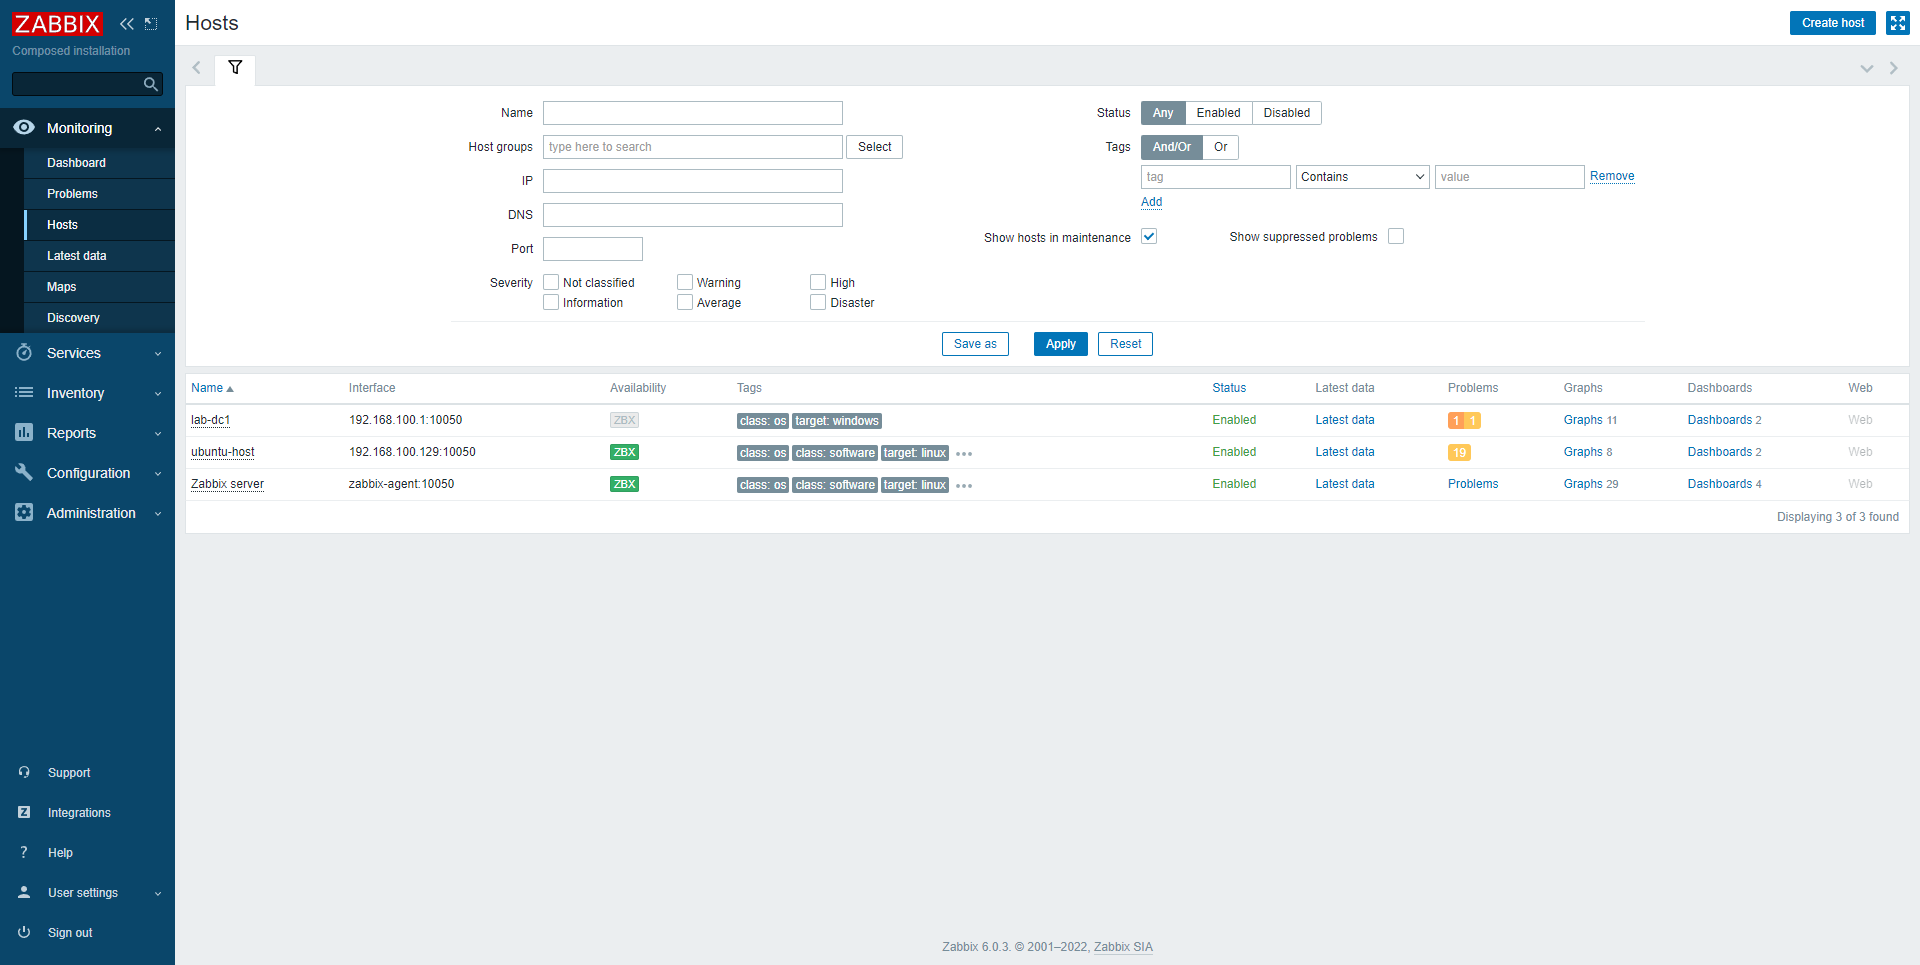
From this page, we have several ways to see the data:
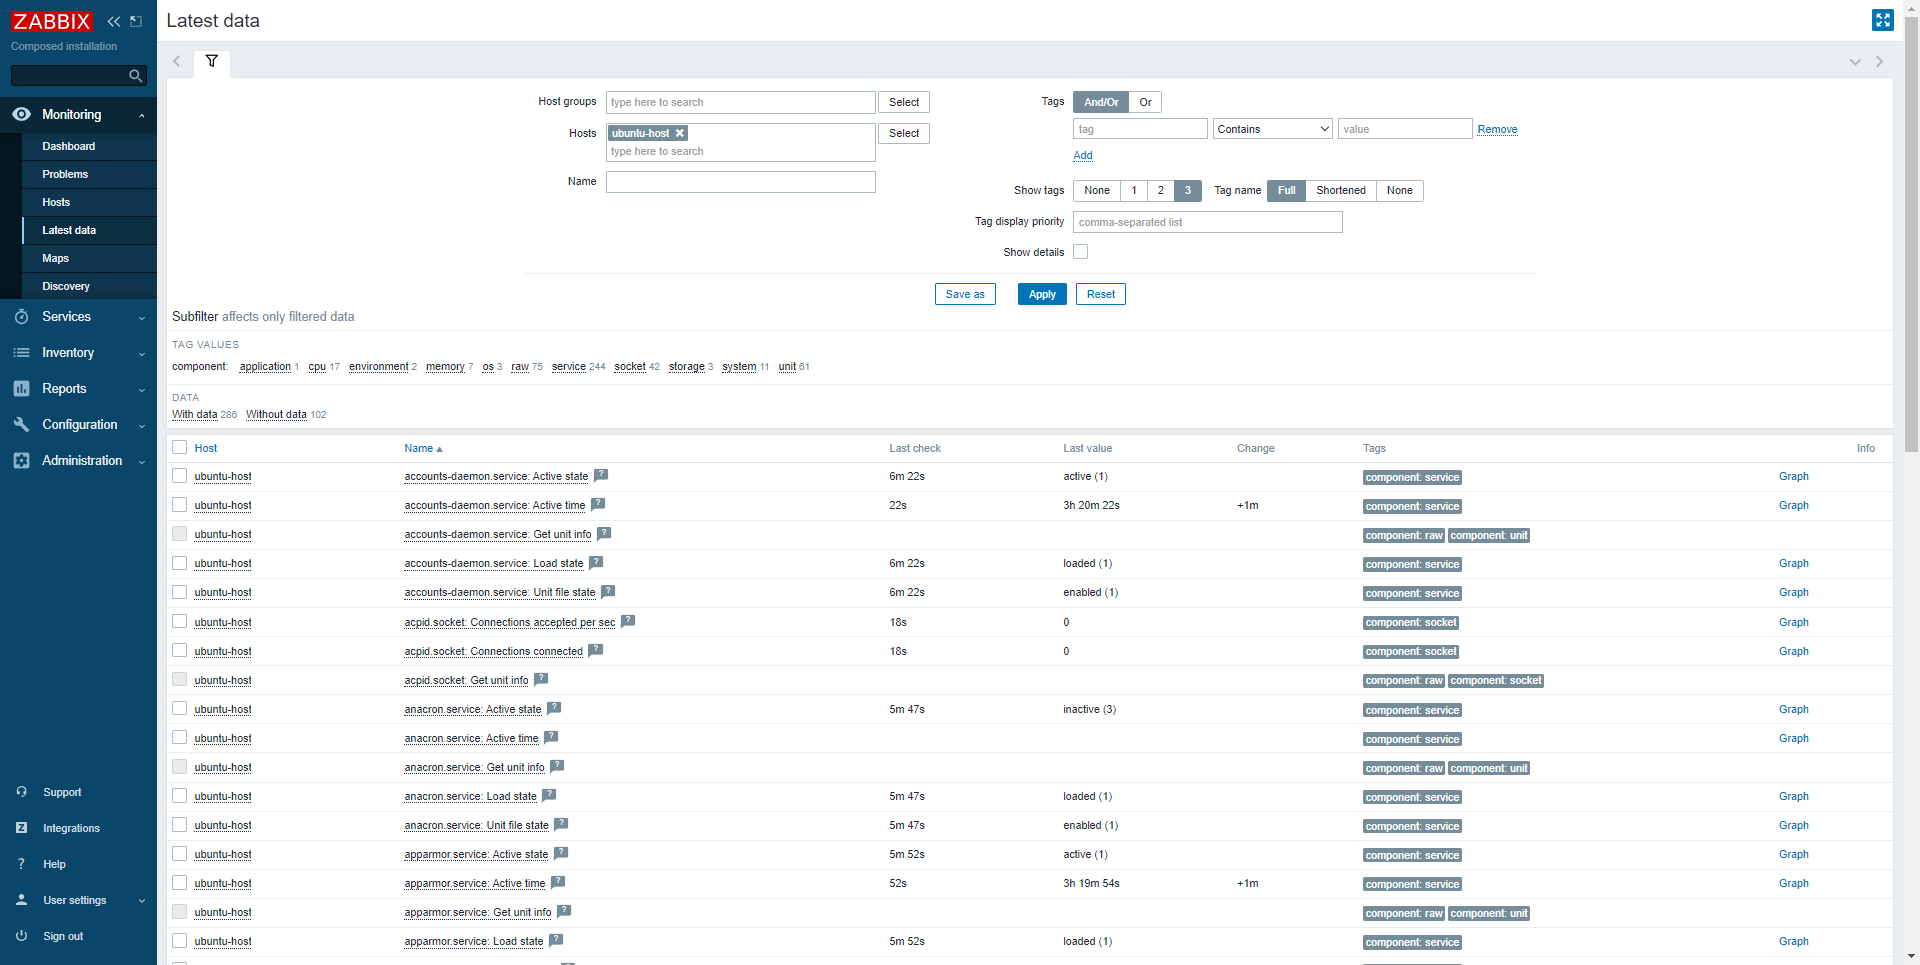
- Latest data : affiche les données numérique de supervision
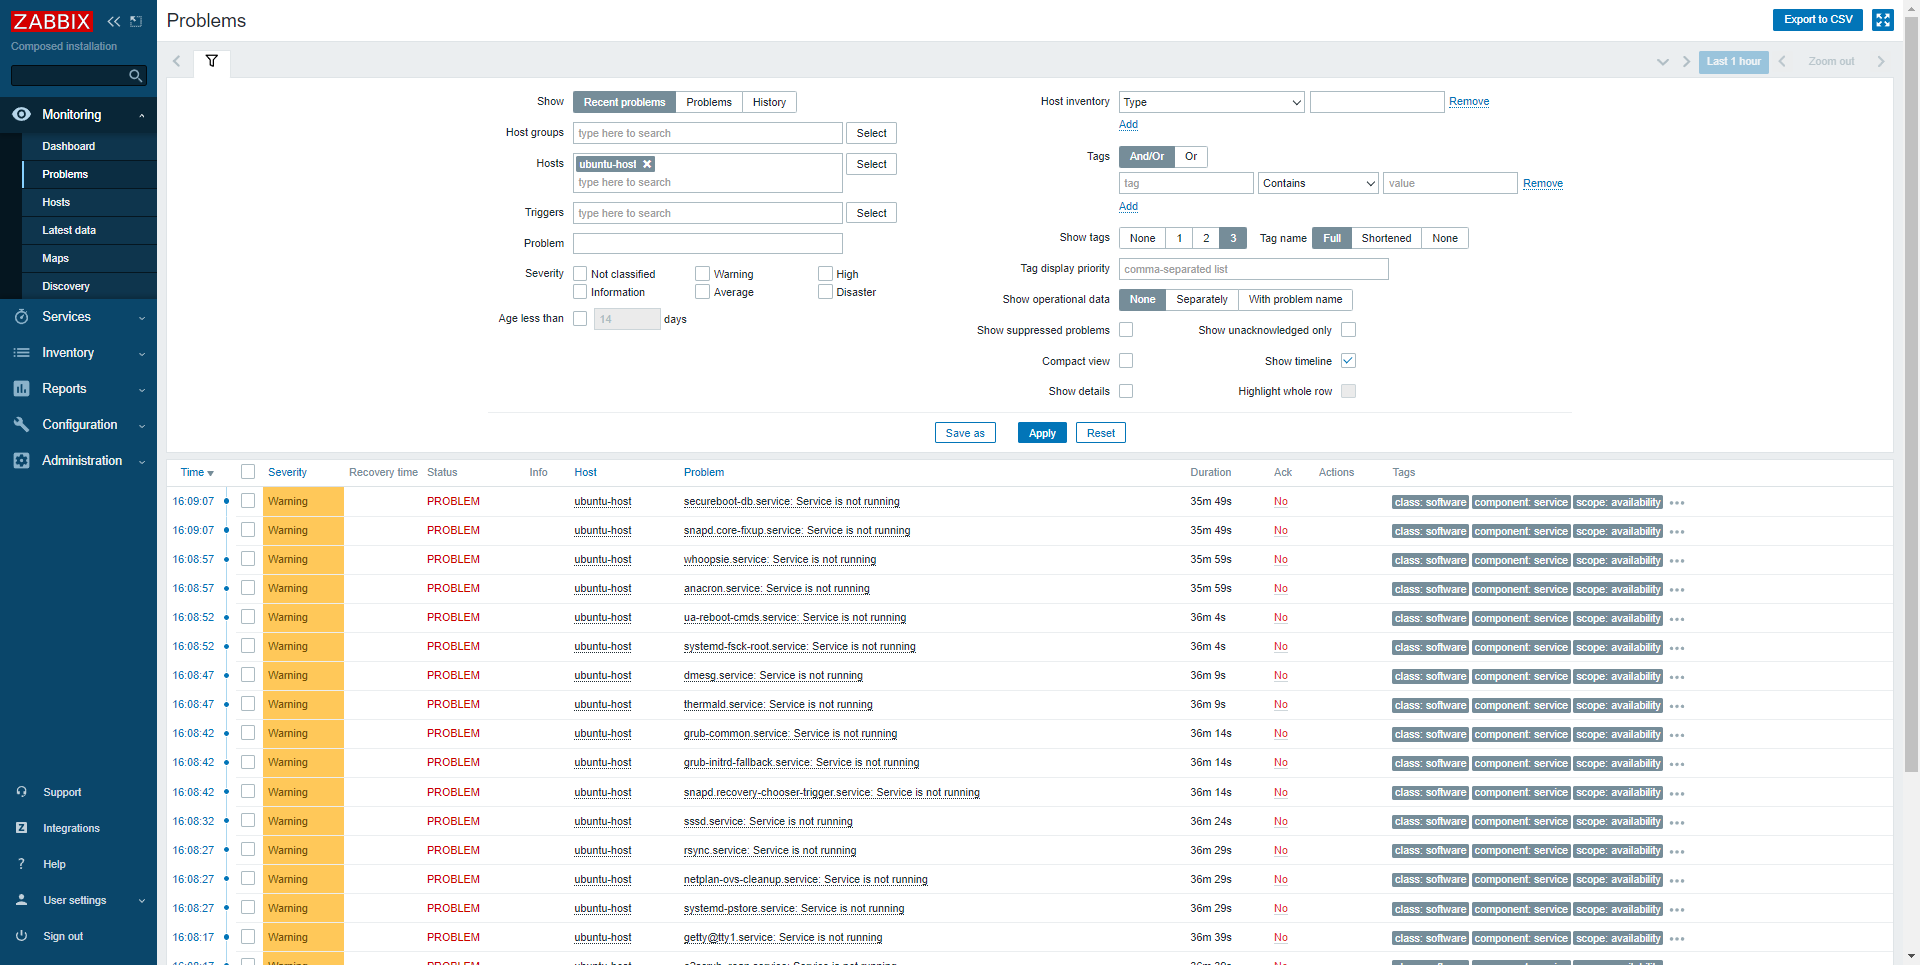
- Problems : indicates if there are any alerts
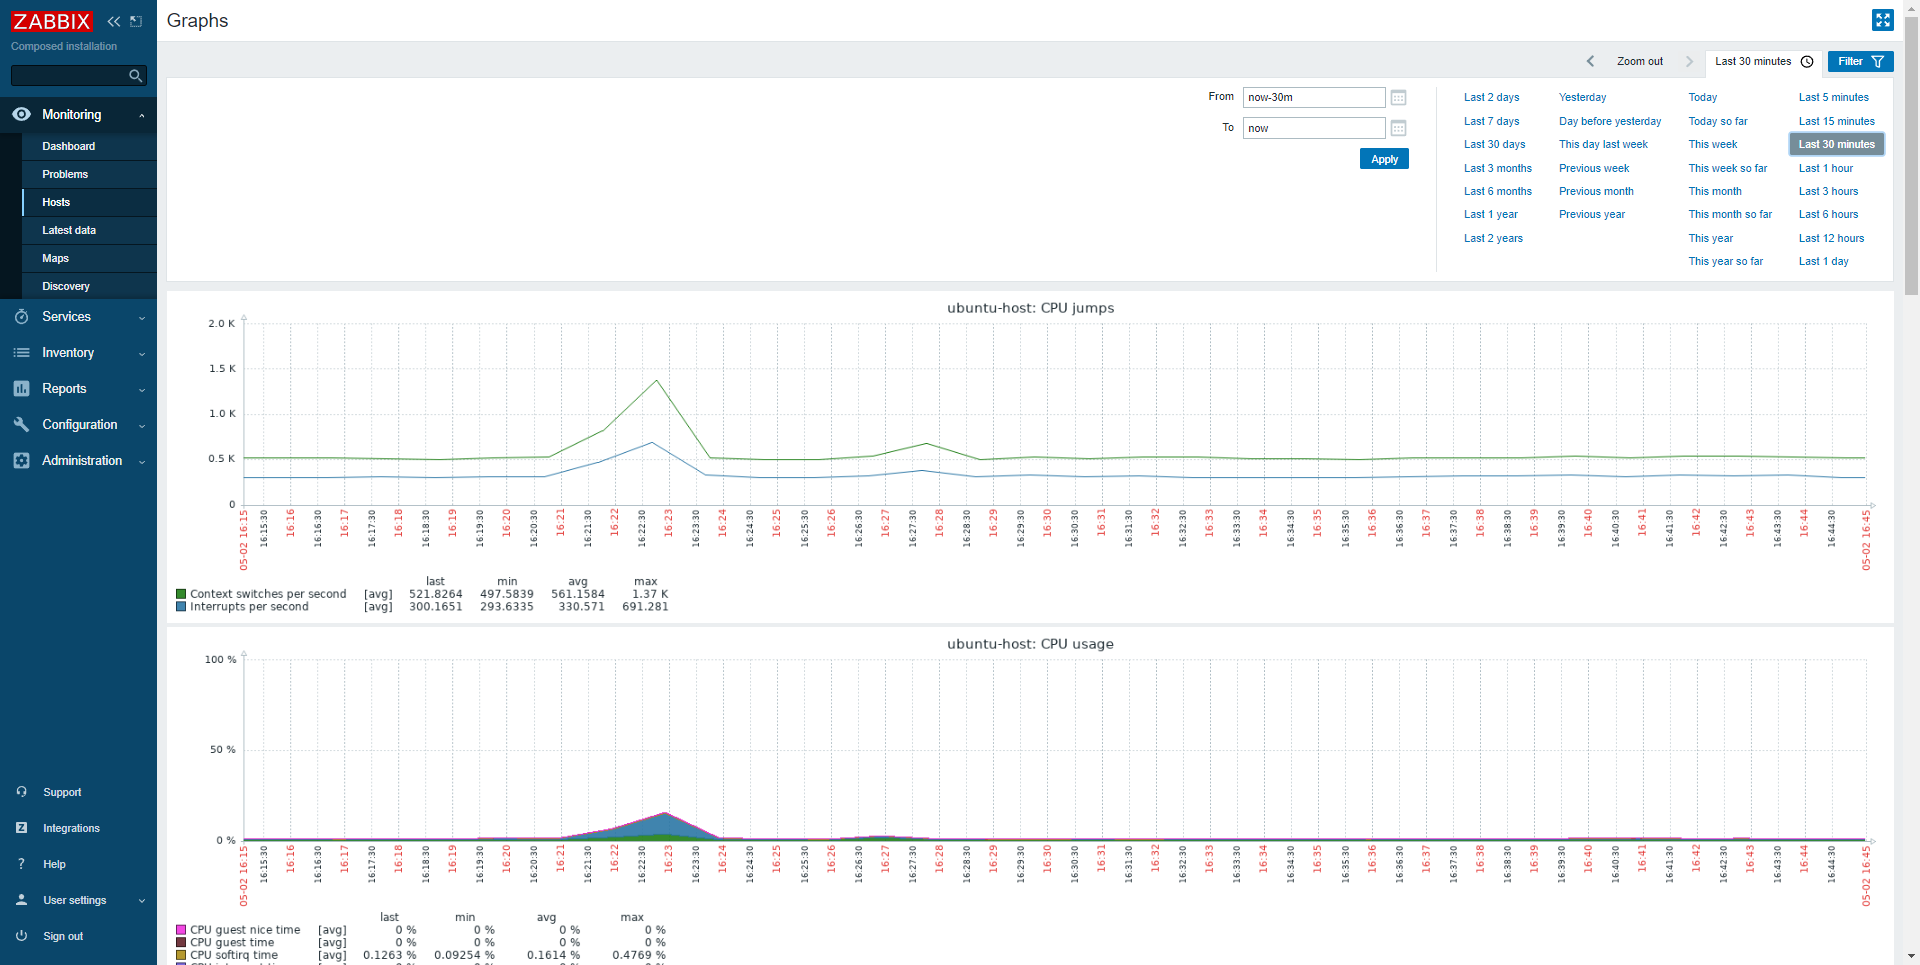
- Graphs : allows to see all the graphs of the elements
- Dashboard : allows to have a logic of different graphs.
Voici quelques captures :
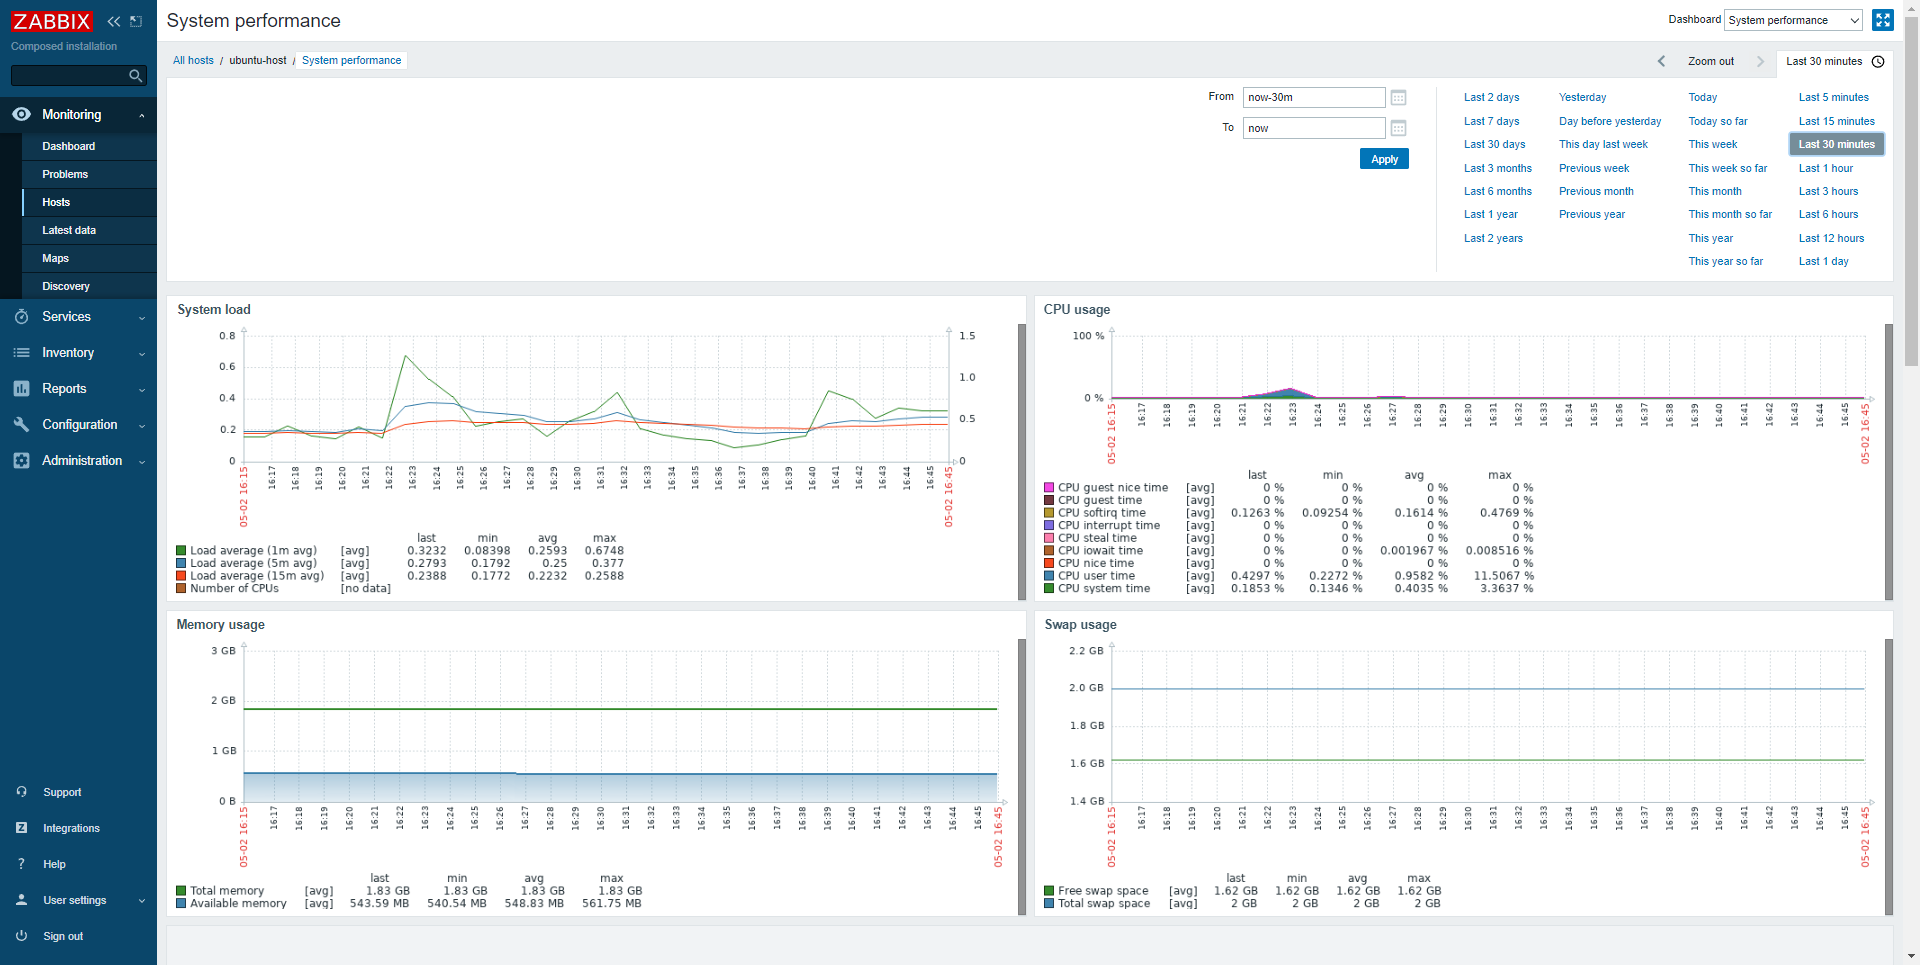
Two other Dashboard examples:
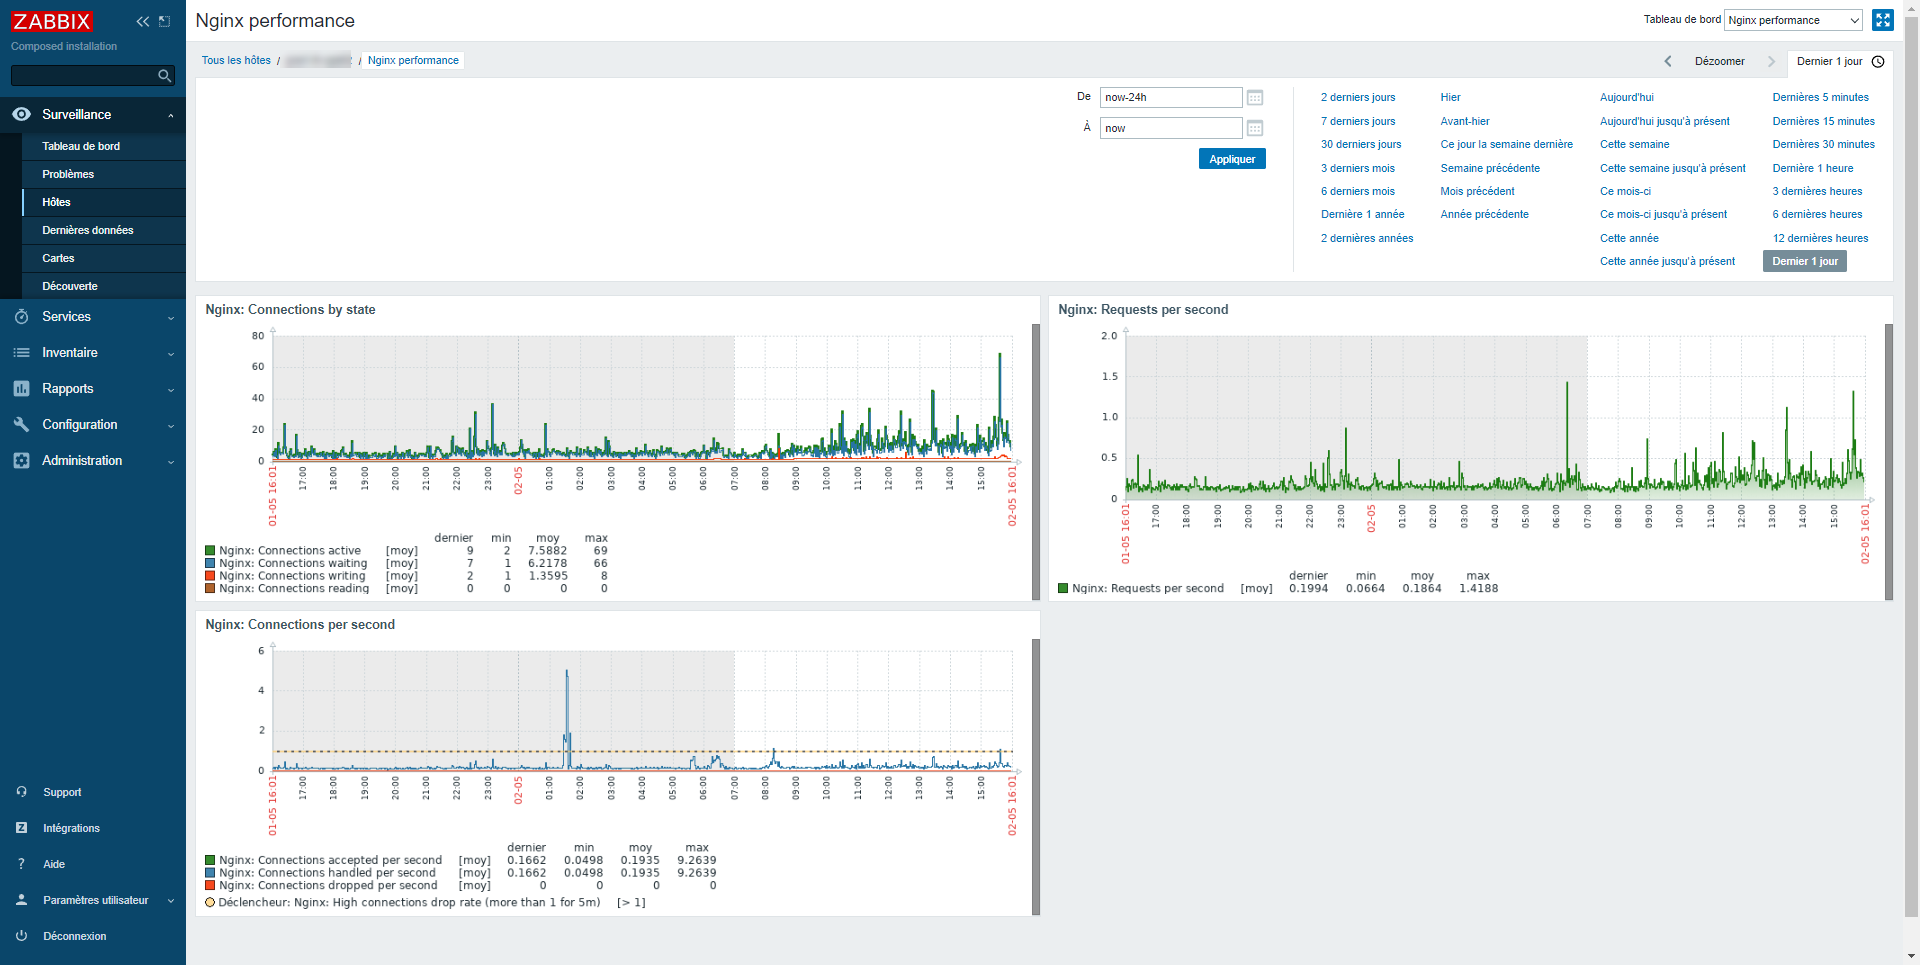
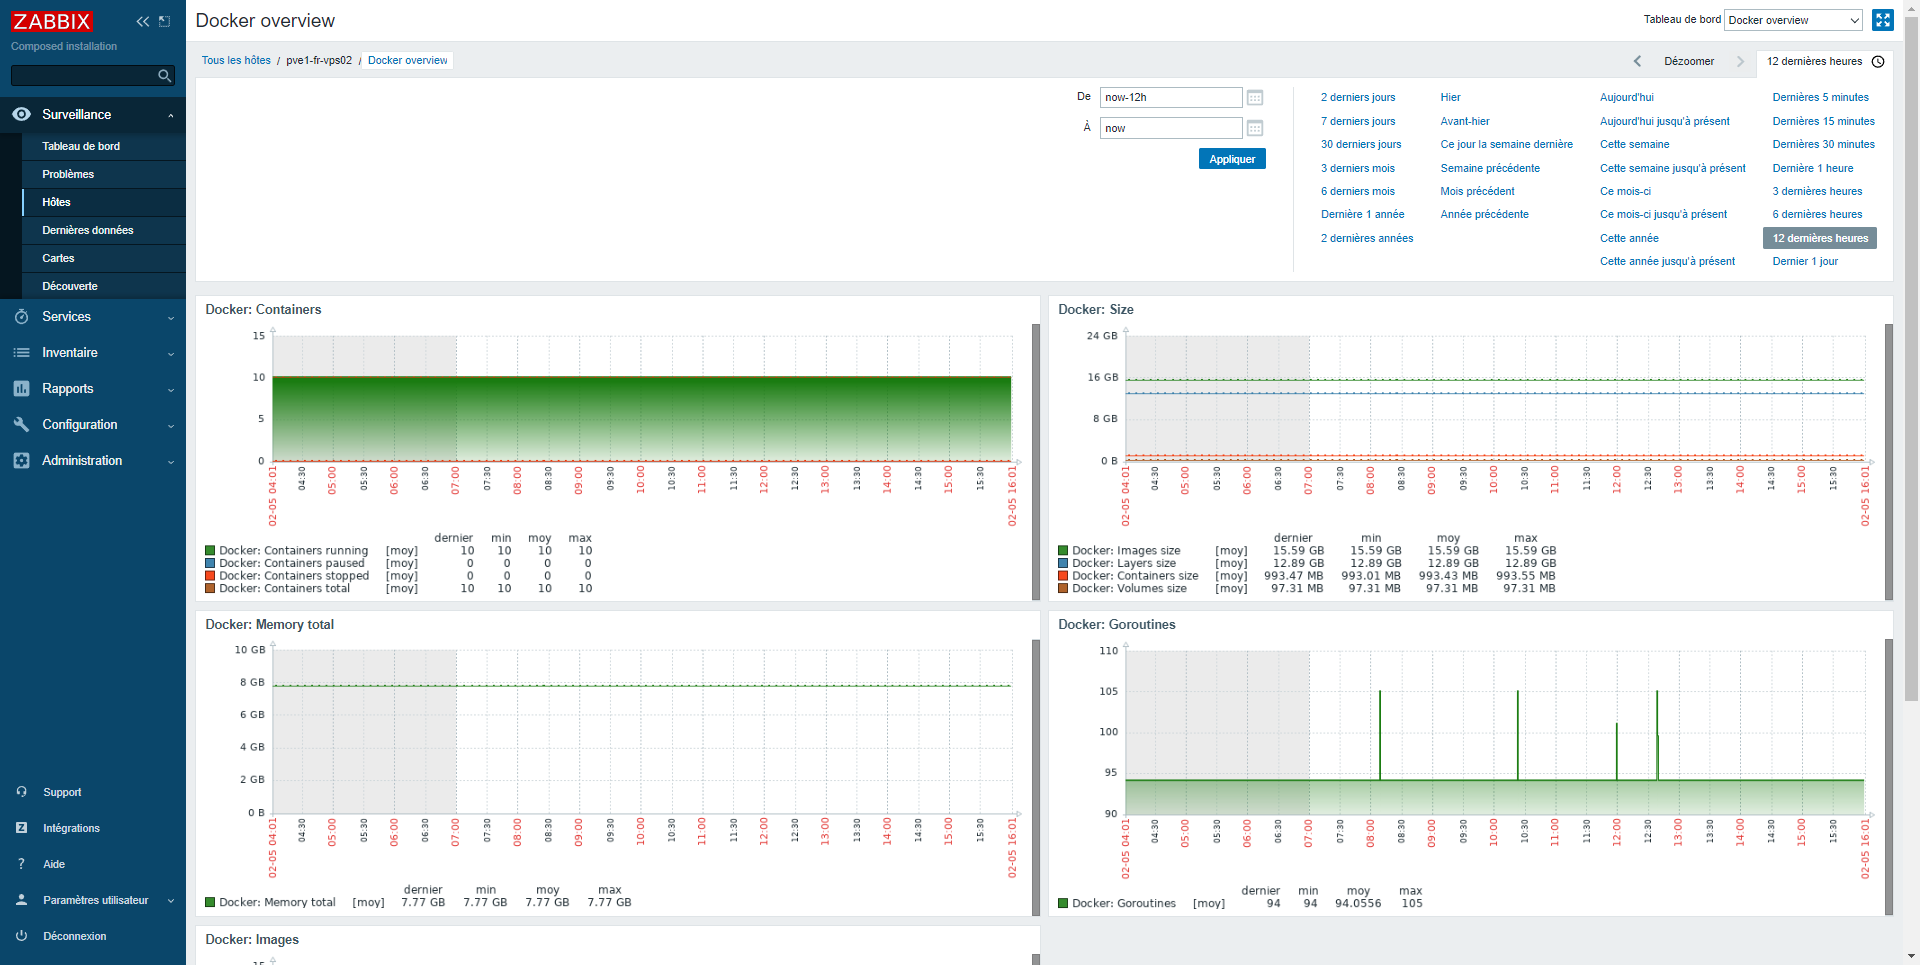
To change Dashboard, use the selector at the top right of the page.
I let you discover your data for yourself.
To finish …
This first tutorial dedicated to Zabbix ends here, there are still plenty of things to see and other tutorials will follow (where are already online depending on when you read this one).
I will also write articles explaining how things work like the difference between active and passive agents.
If you have any questions, ask them in comments.
Now you know how to install Zabbix and monitor your first hosts.