In this tutorial, I will explain to you how to monitor a website using Zabbix.
The supervision of Internet sites is done using Web scenarios and it is possible to add parameters for example if authentication is necessary, here we will simply keep it as simple as possible.
With Zabbix here is the information you will be able to have:
- The HTTP code, a normal code is 2XX
- The response time of your website
- Speed (bandwidth).
The supervision configuration is done at the agent level, so you can supervise the same website from different networks (VLAN, remote sites, etc.).
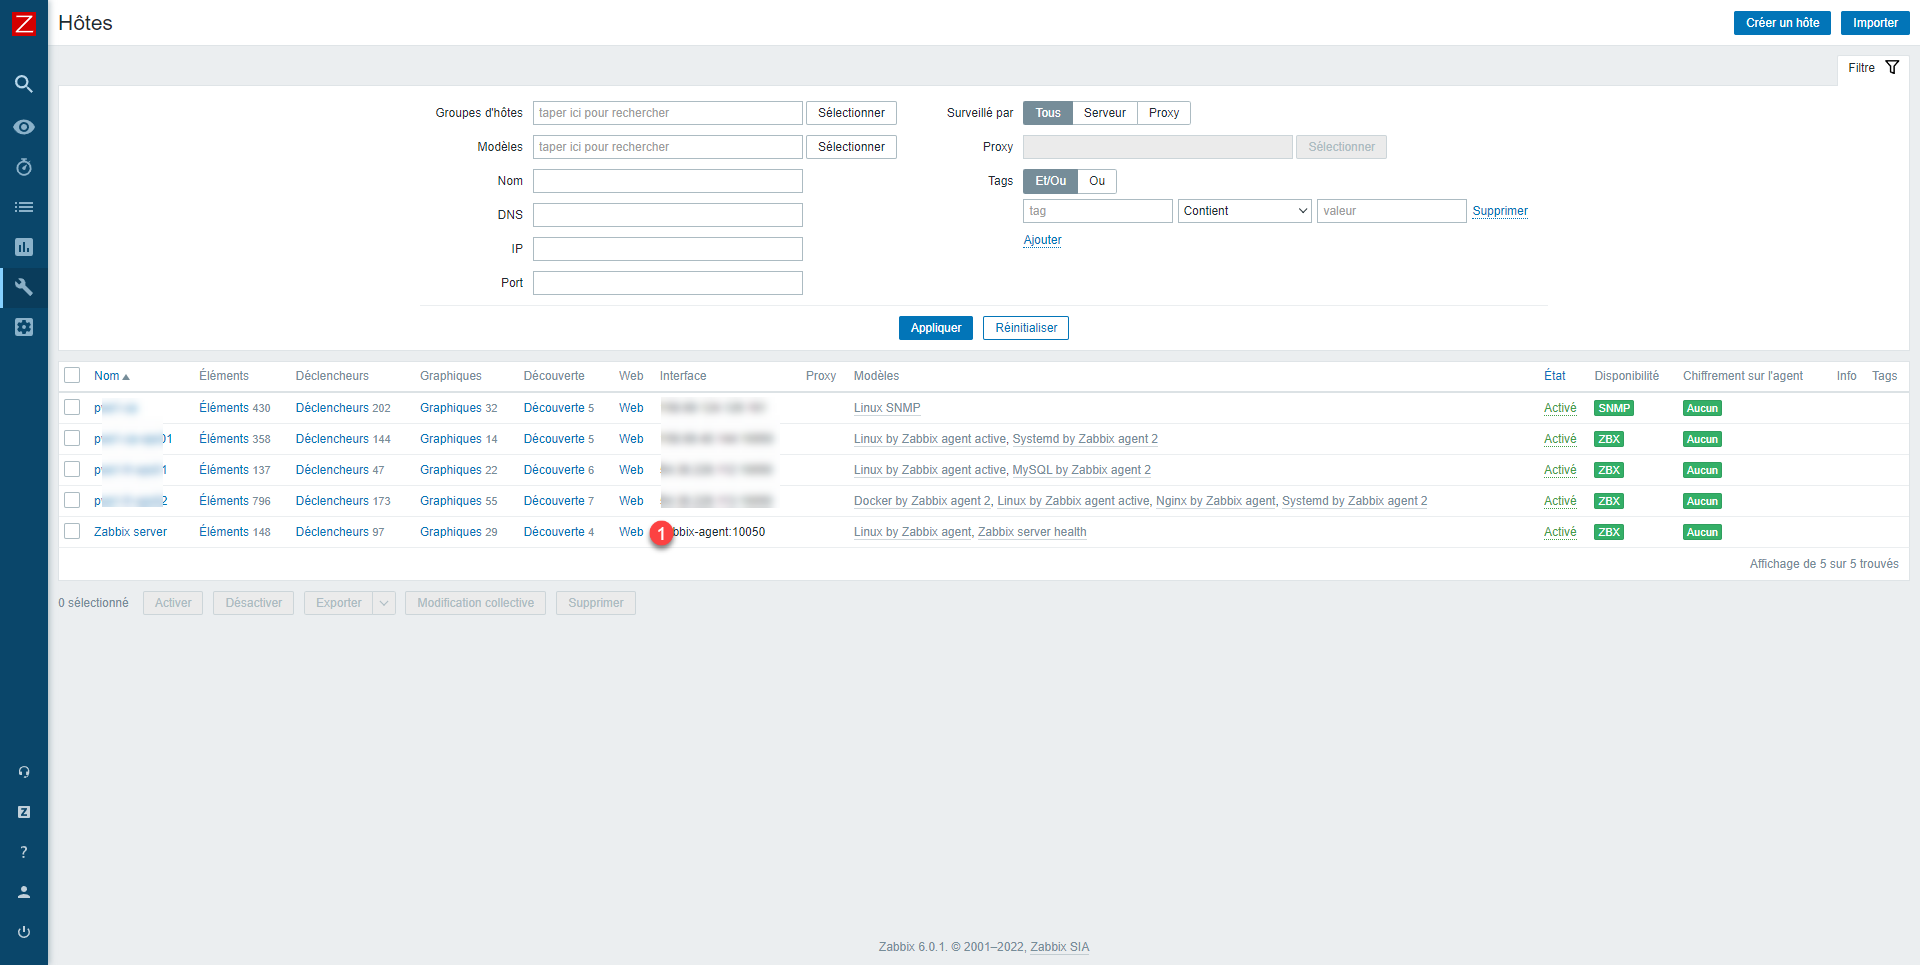
Go to the list of hosts in the Configuration part of Zabbix, click on Web 1 on the agent you want to use for supervision.
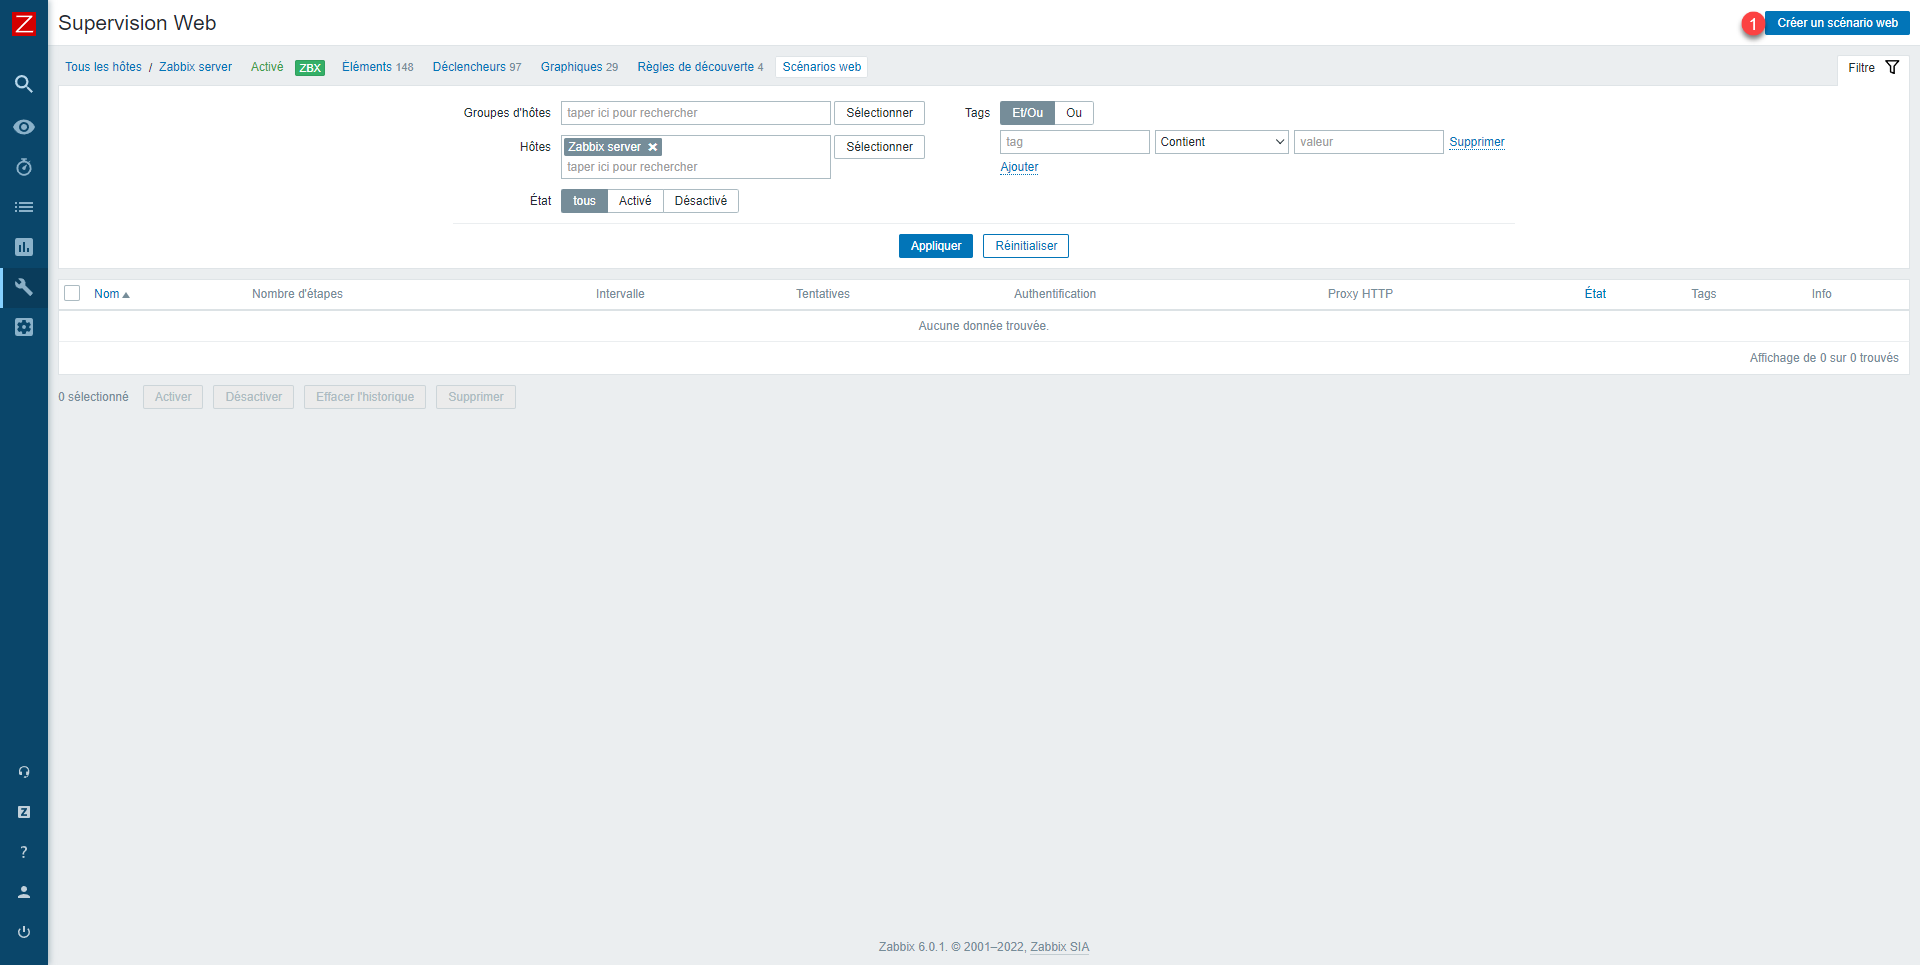
We arrive in the Web Scenario section, here we can manage the different websites supervised by the agent. Click on the Create a web scenario 1 button located at the top right.
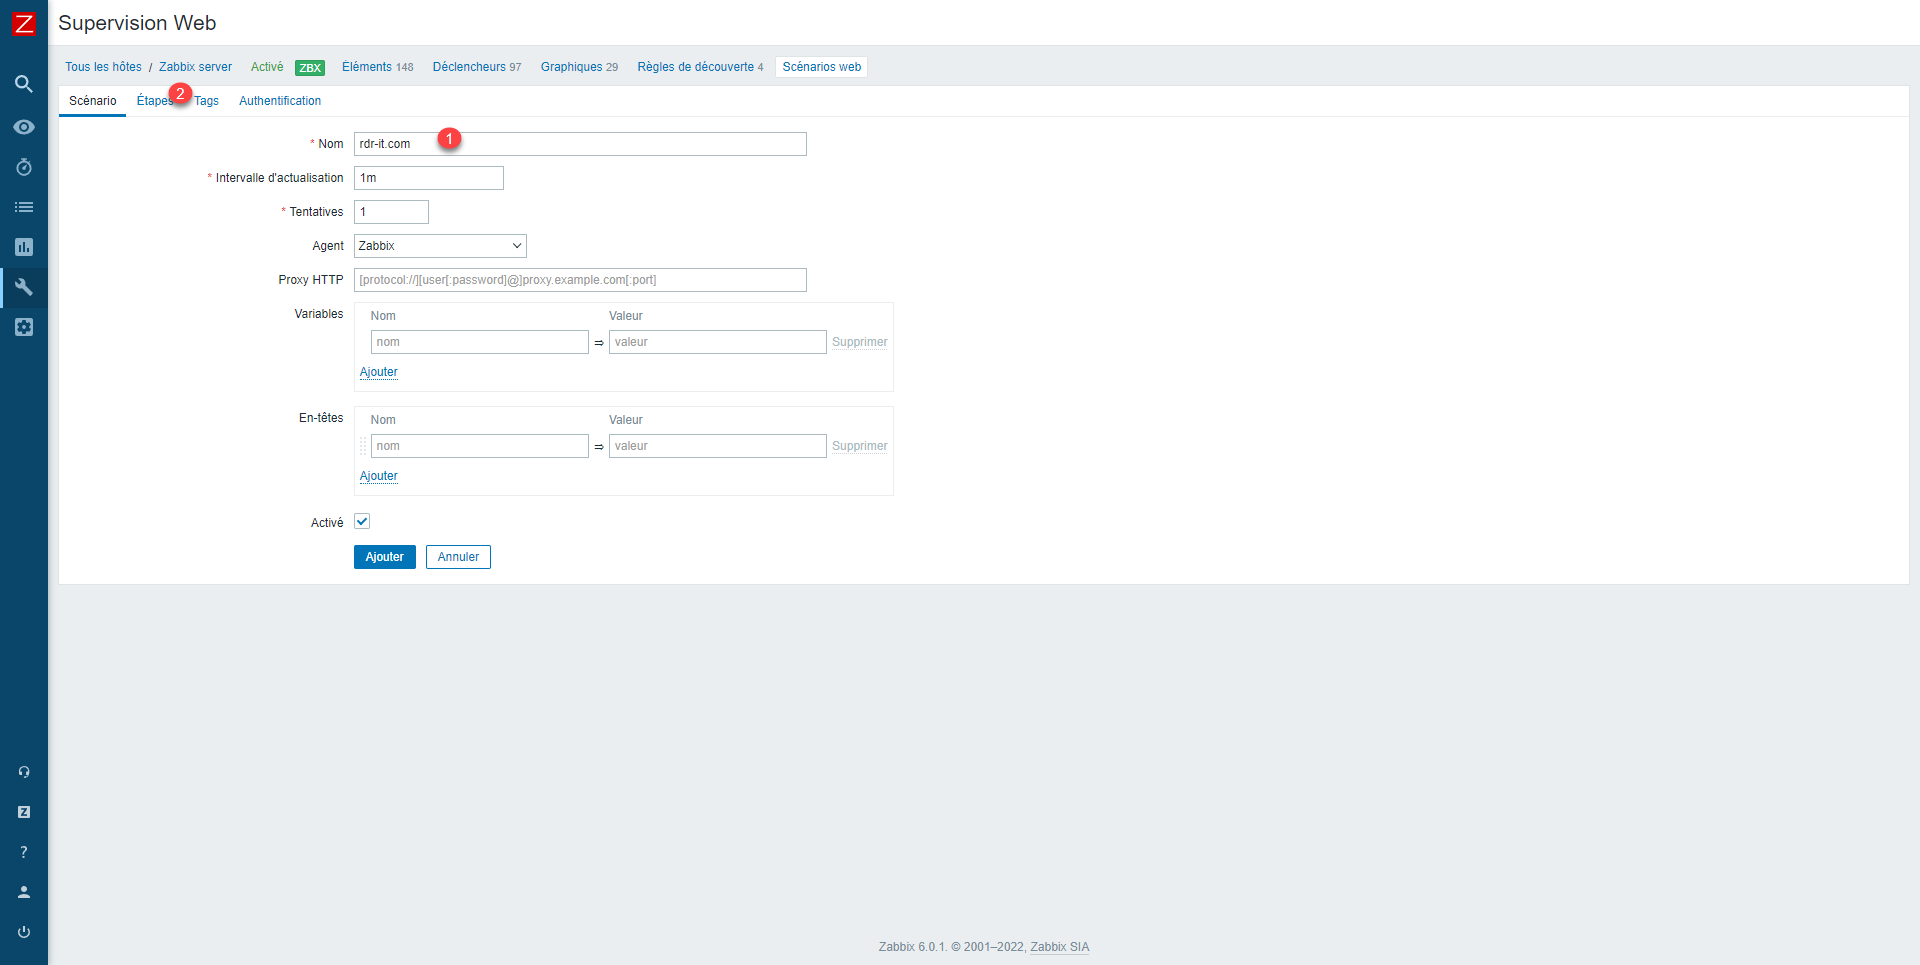
Name the scenario 1 then click on Steps 2.
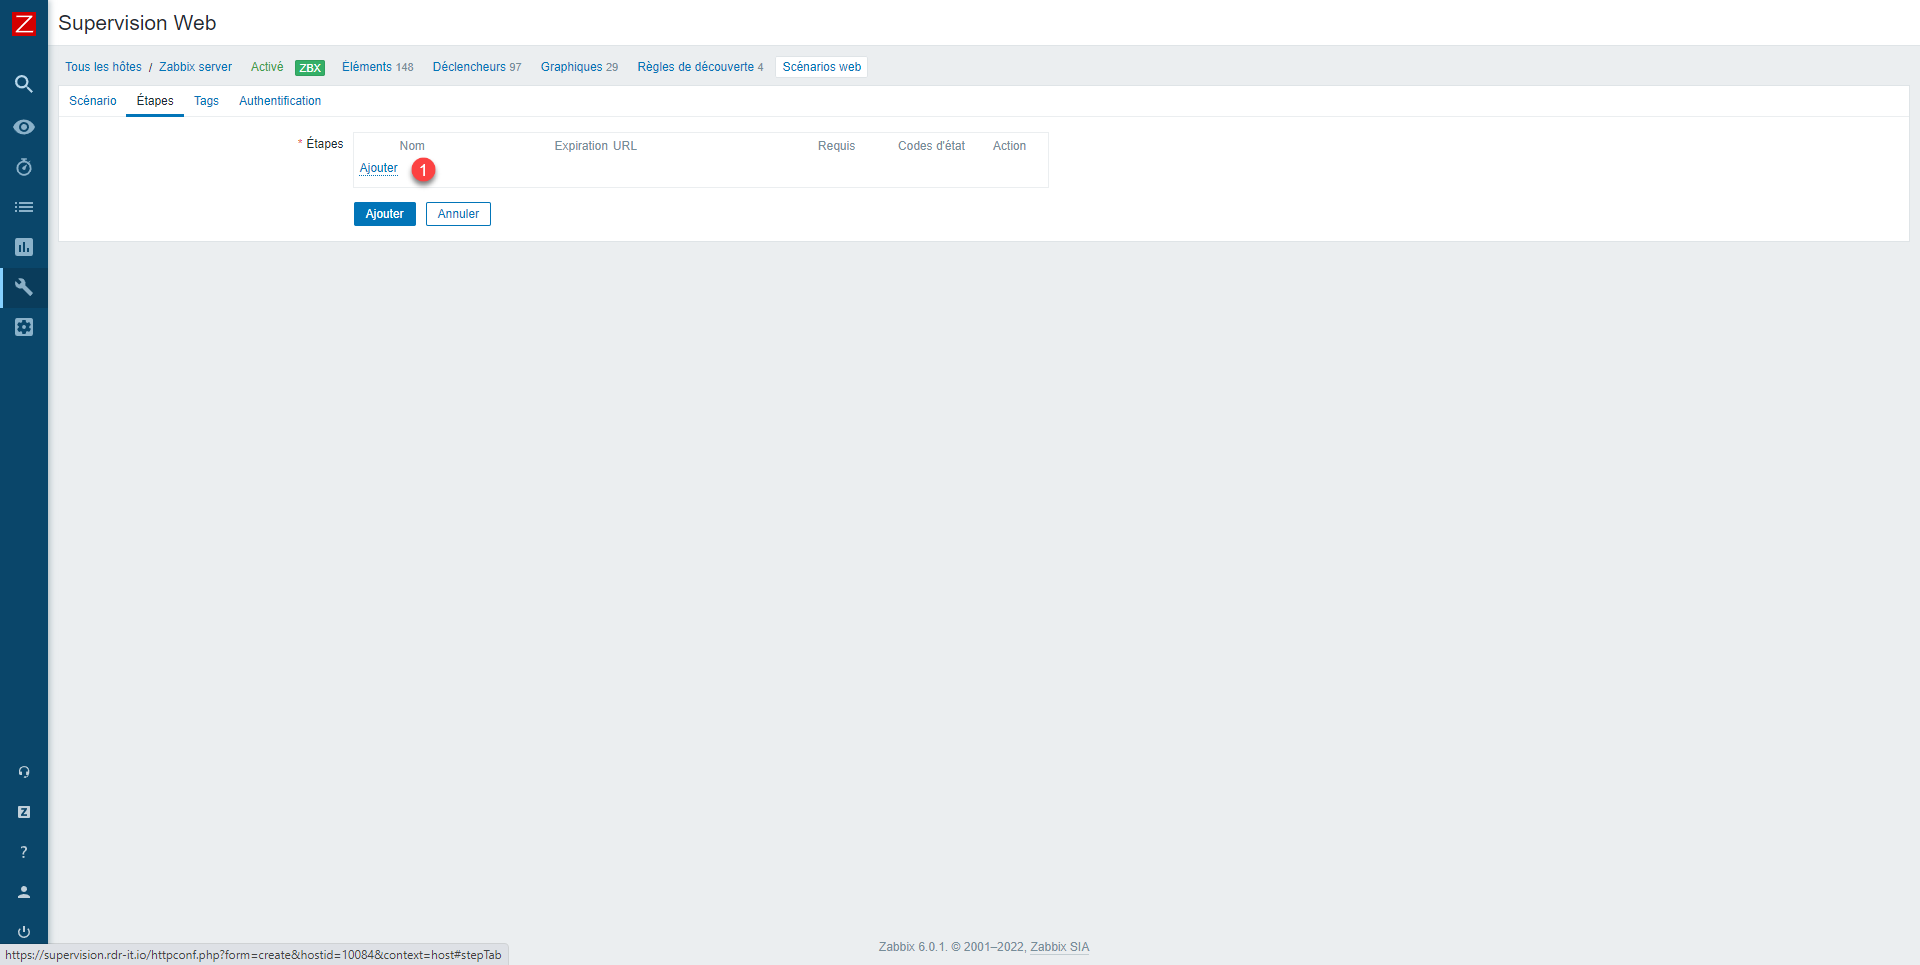
In the Steps section, click on Add 1.
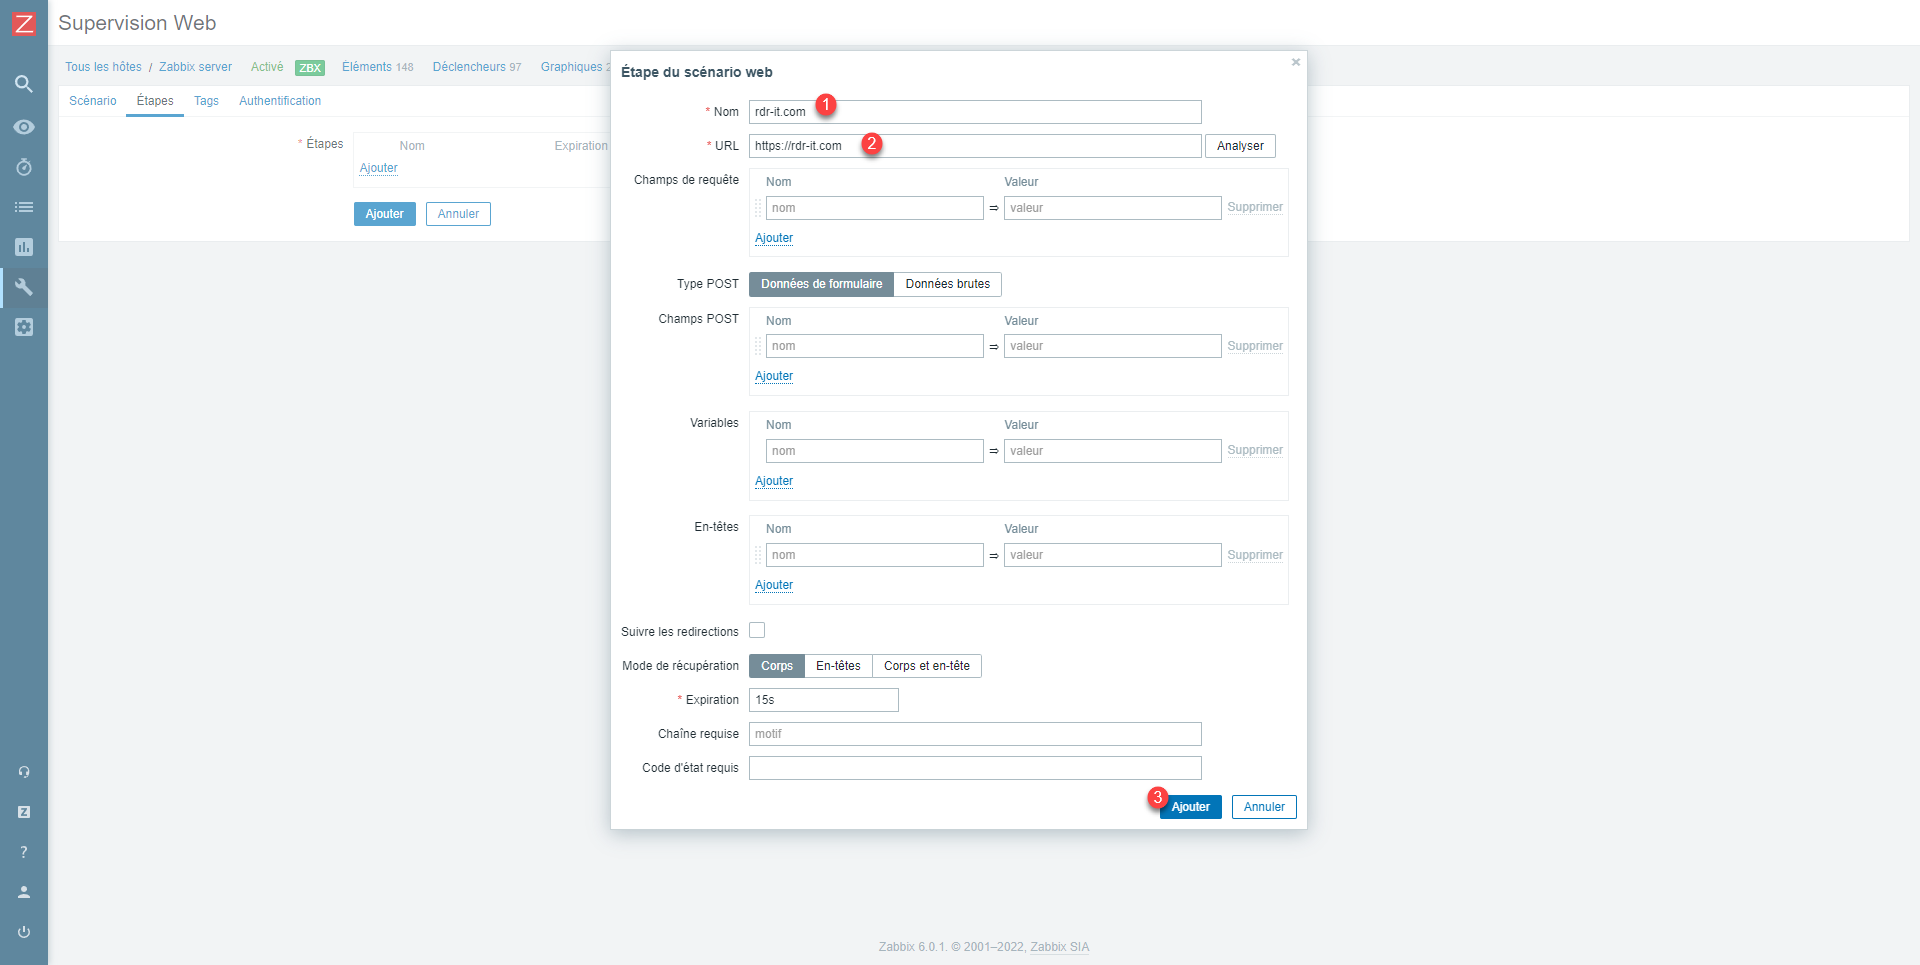
Name the step 1 then enter the URL 2 and finish by clicking on Add 3.
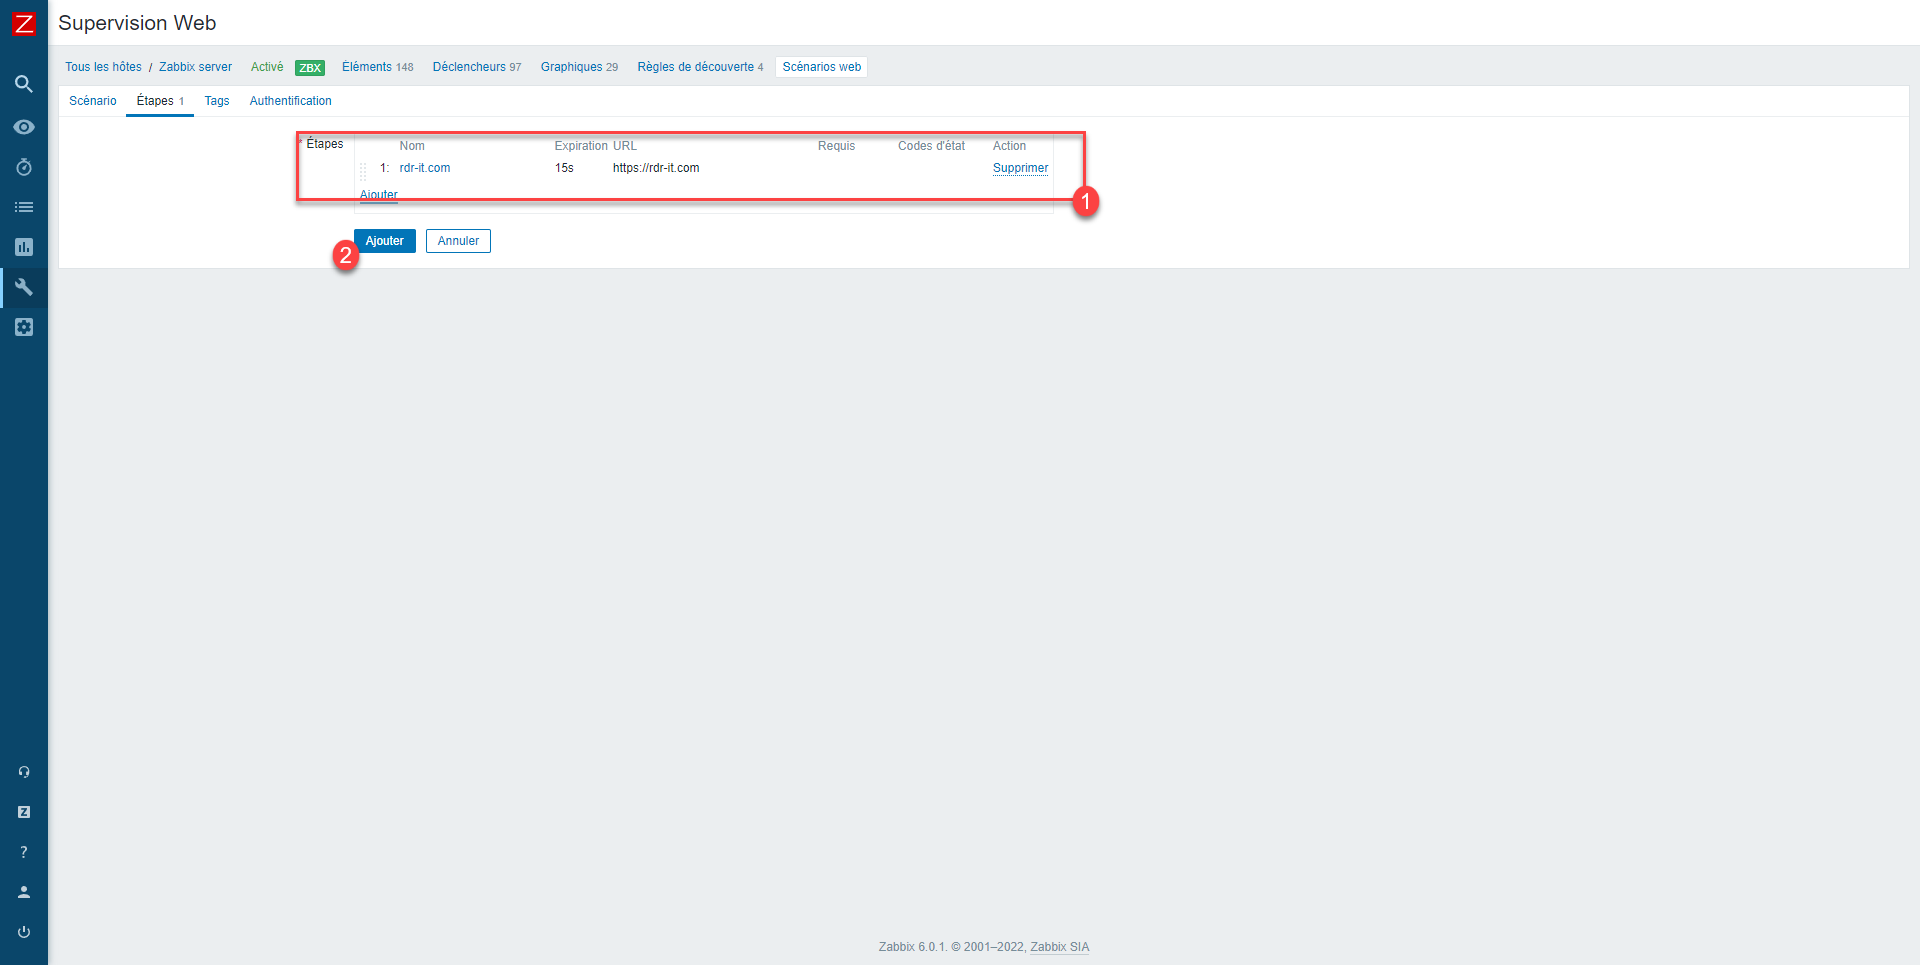
The step is added 1, which will allow the website to be monitored, click on Add 2 to save the Web scenario.
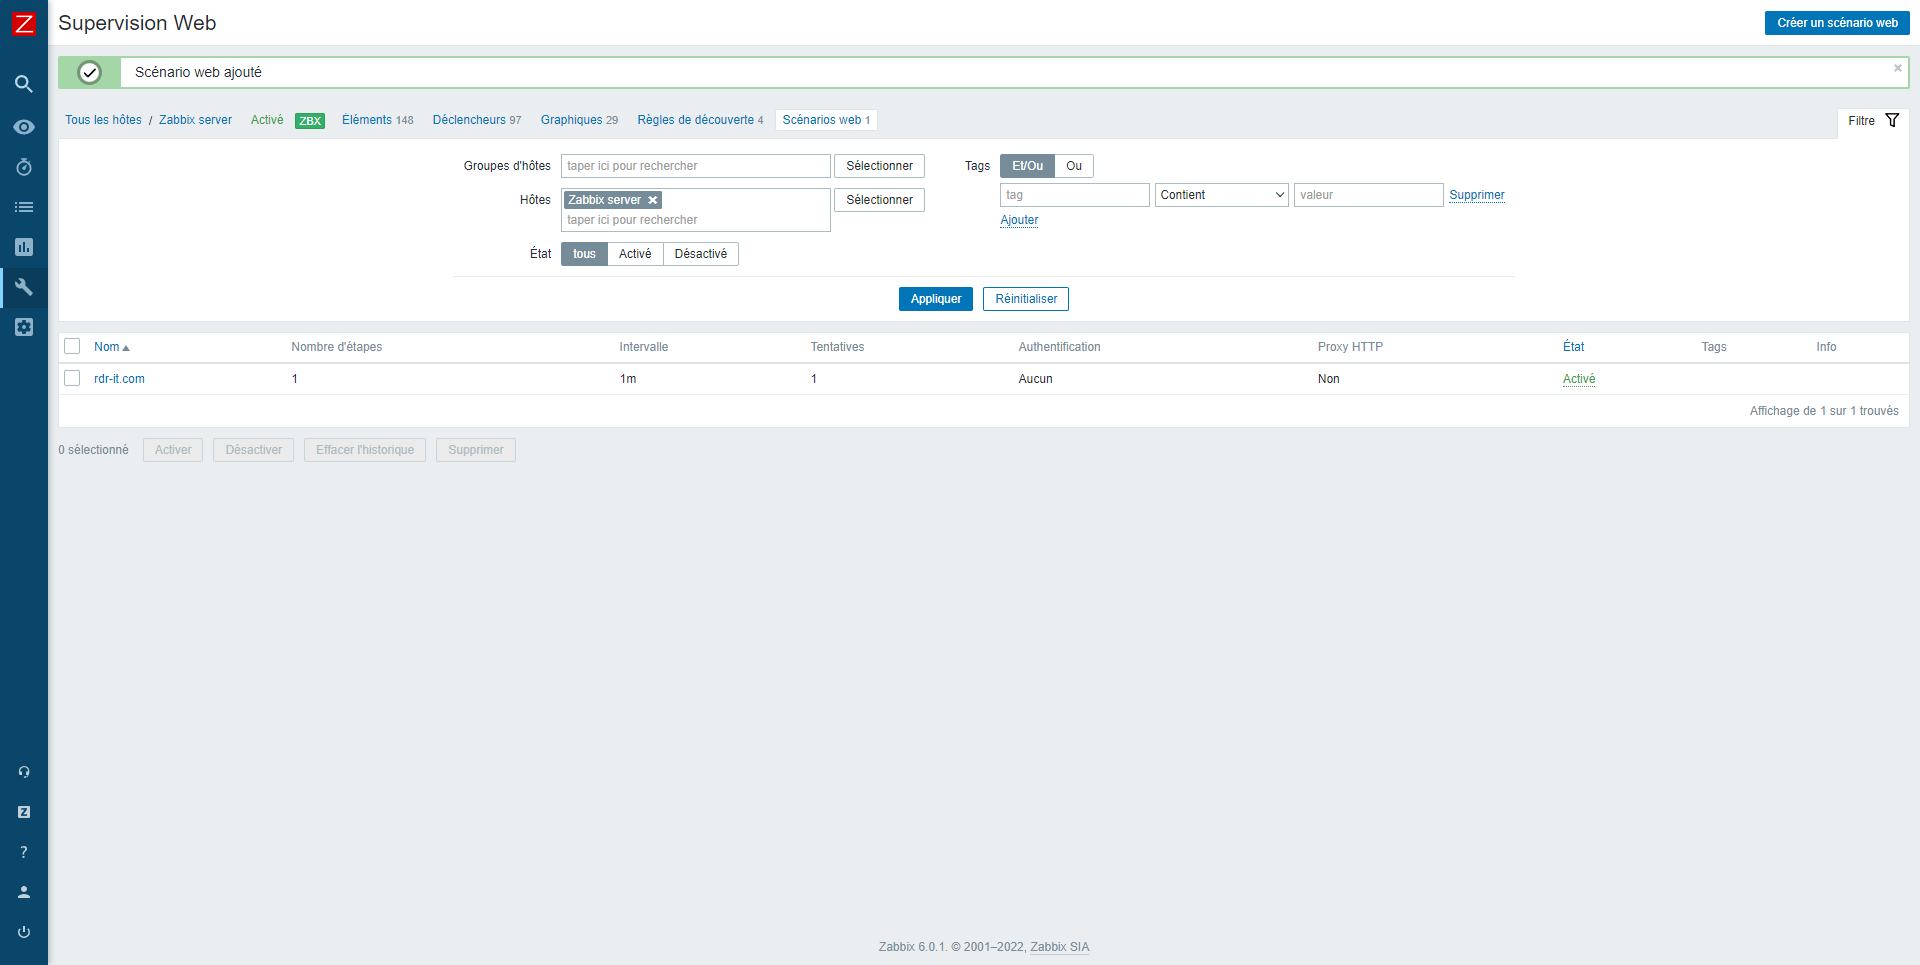
The scenario is added, website monitoring by Zabbix begins.
I will now explain how to access the data.
In the Monitoring part of the navigation menu, click on Hosts 1.
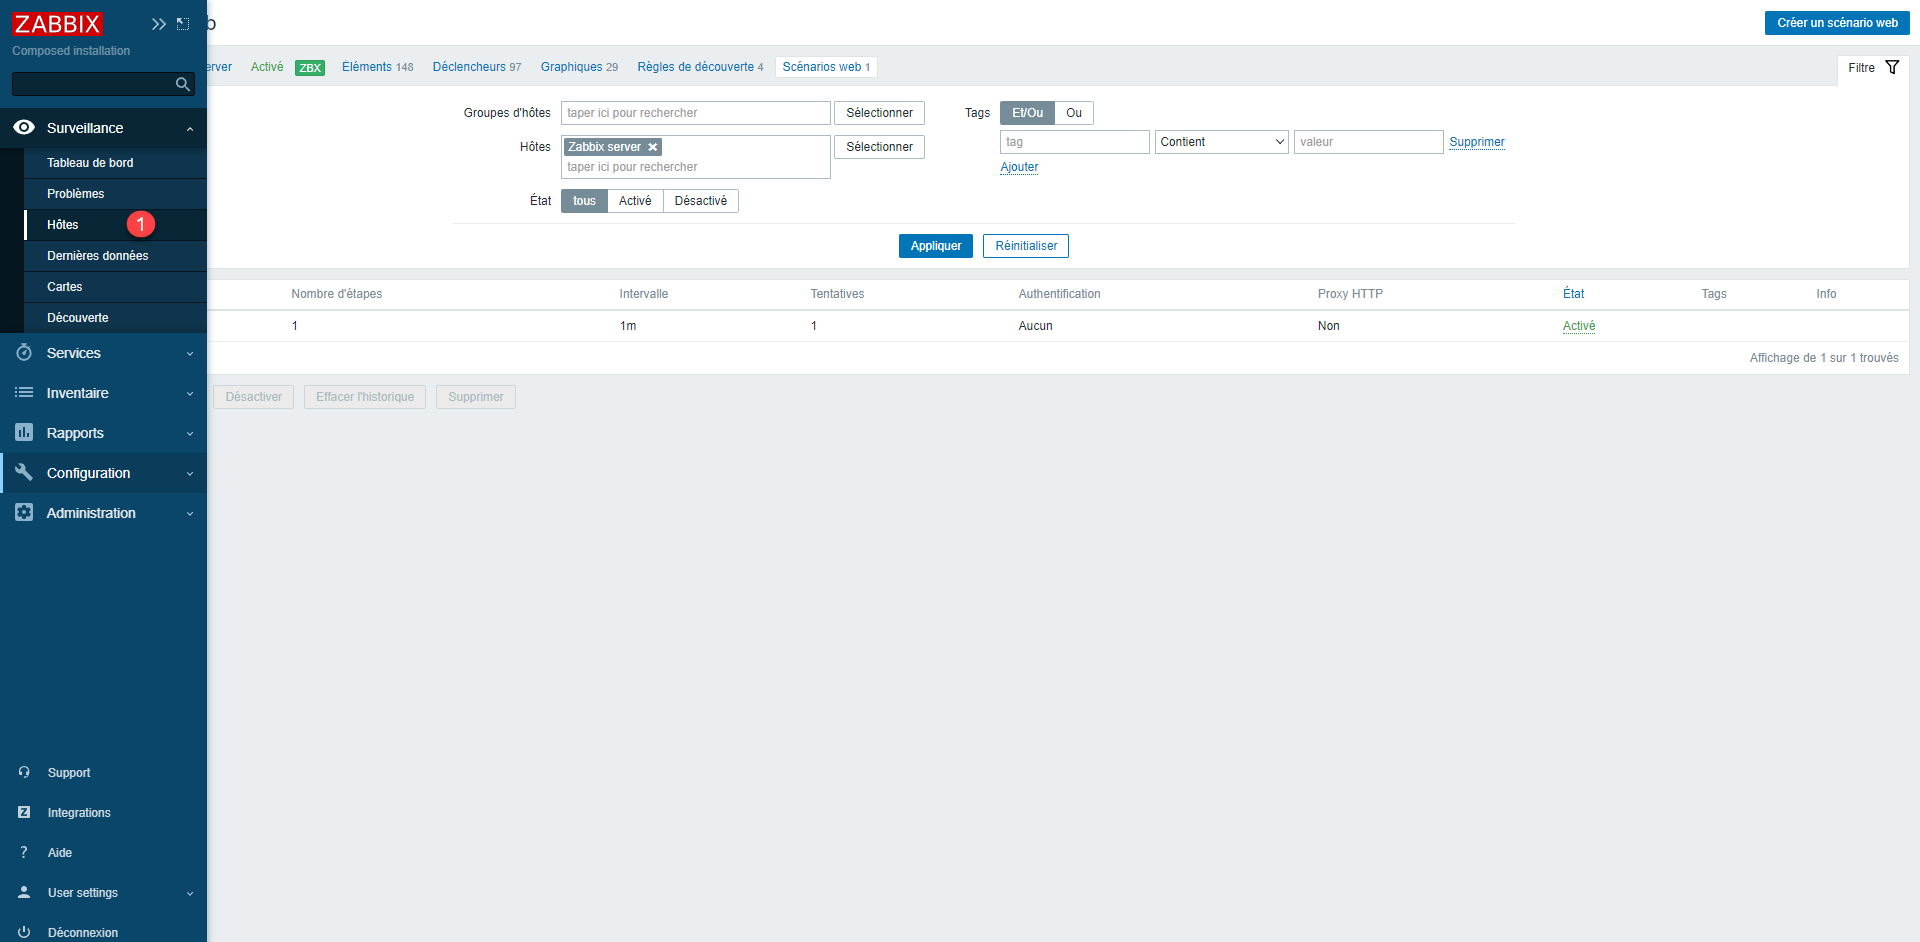
From the list of hosts, we can see that the Zabbix_server host has a Web scenario 1 in supervision, click on the link.
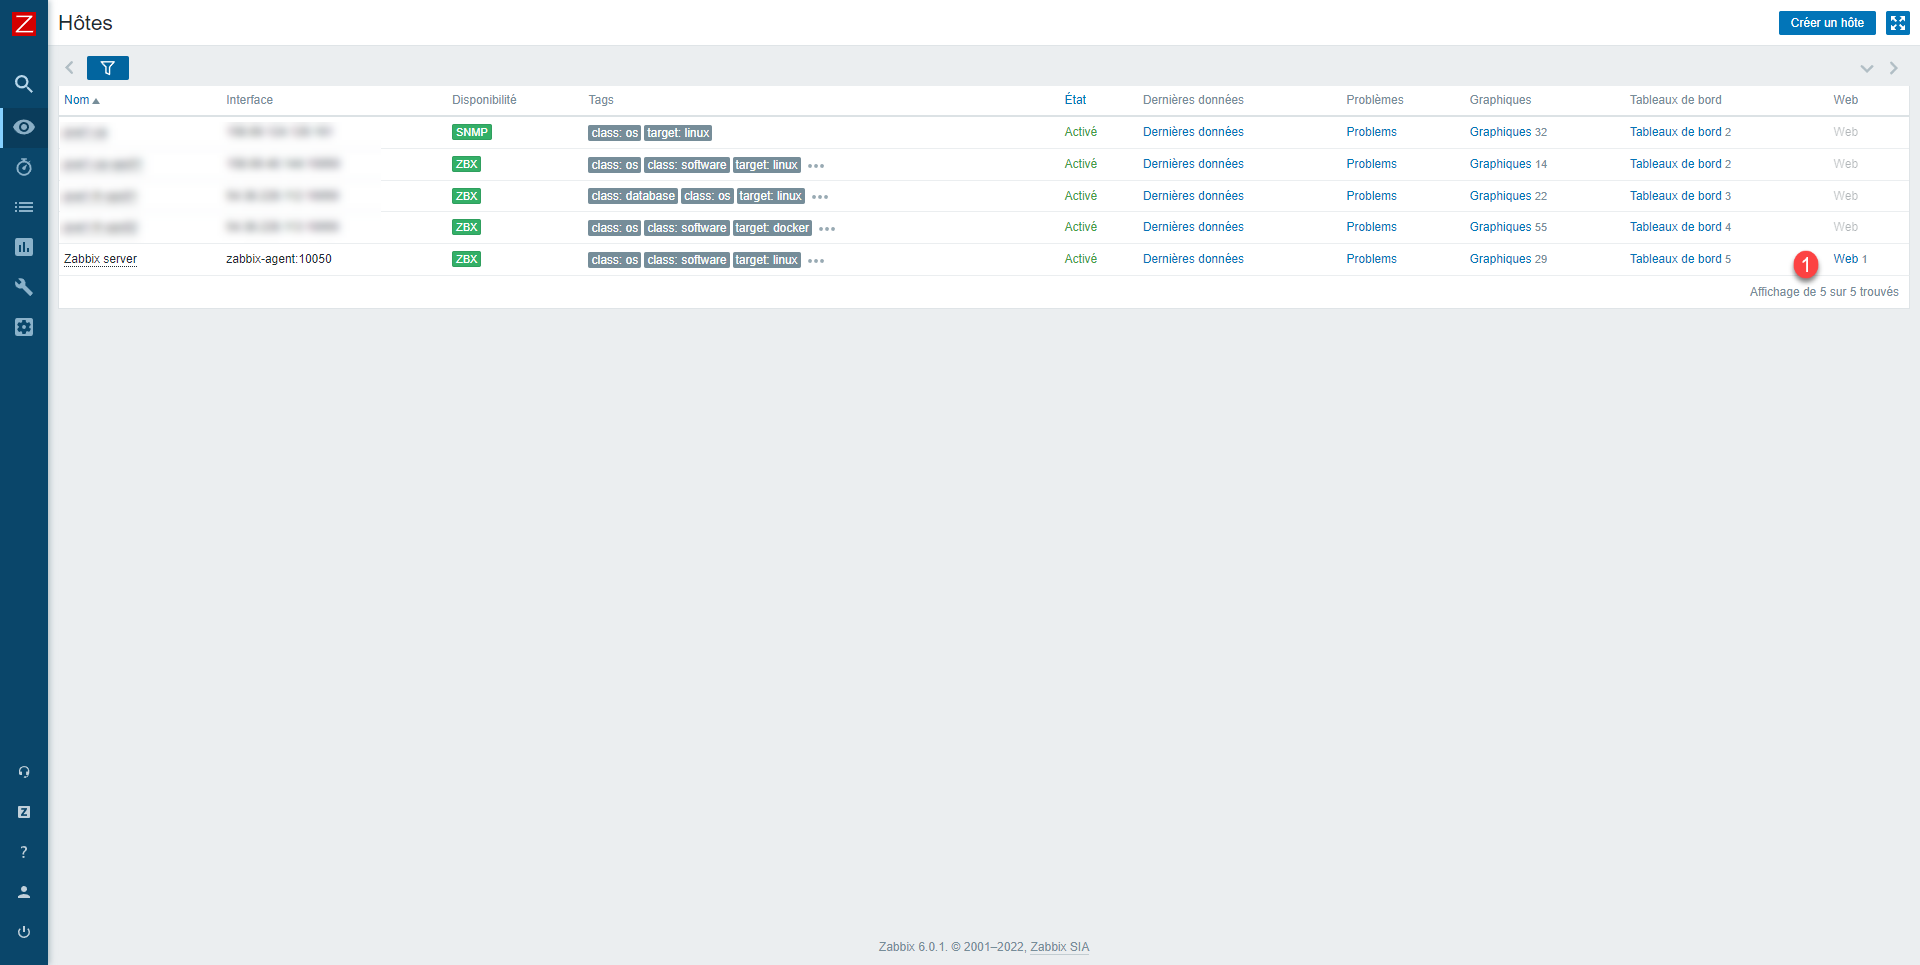
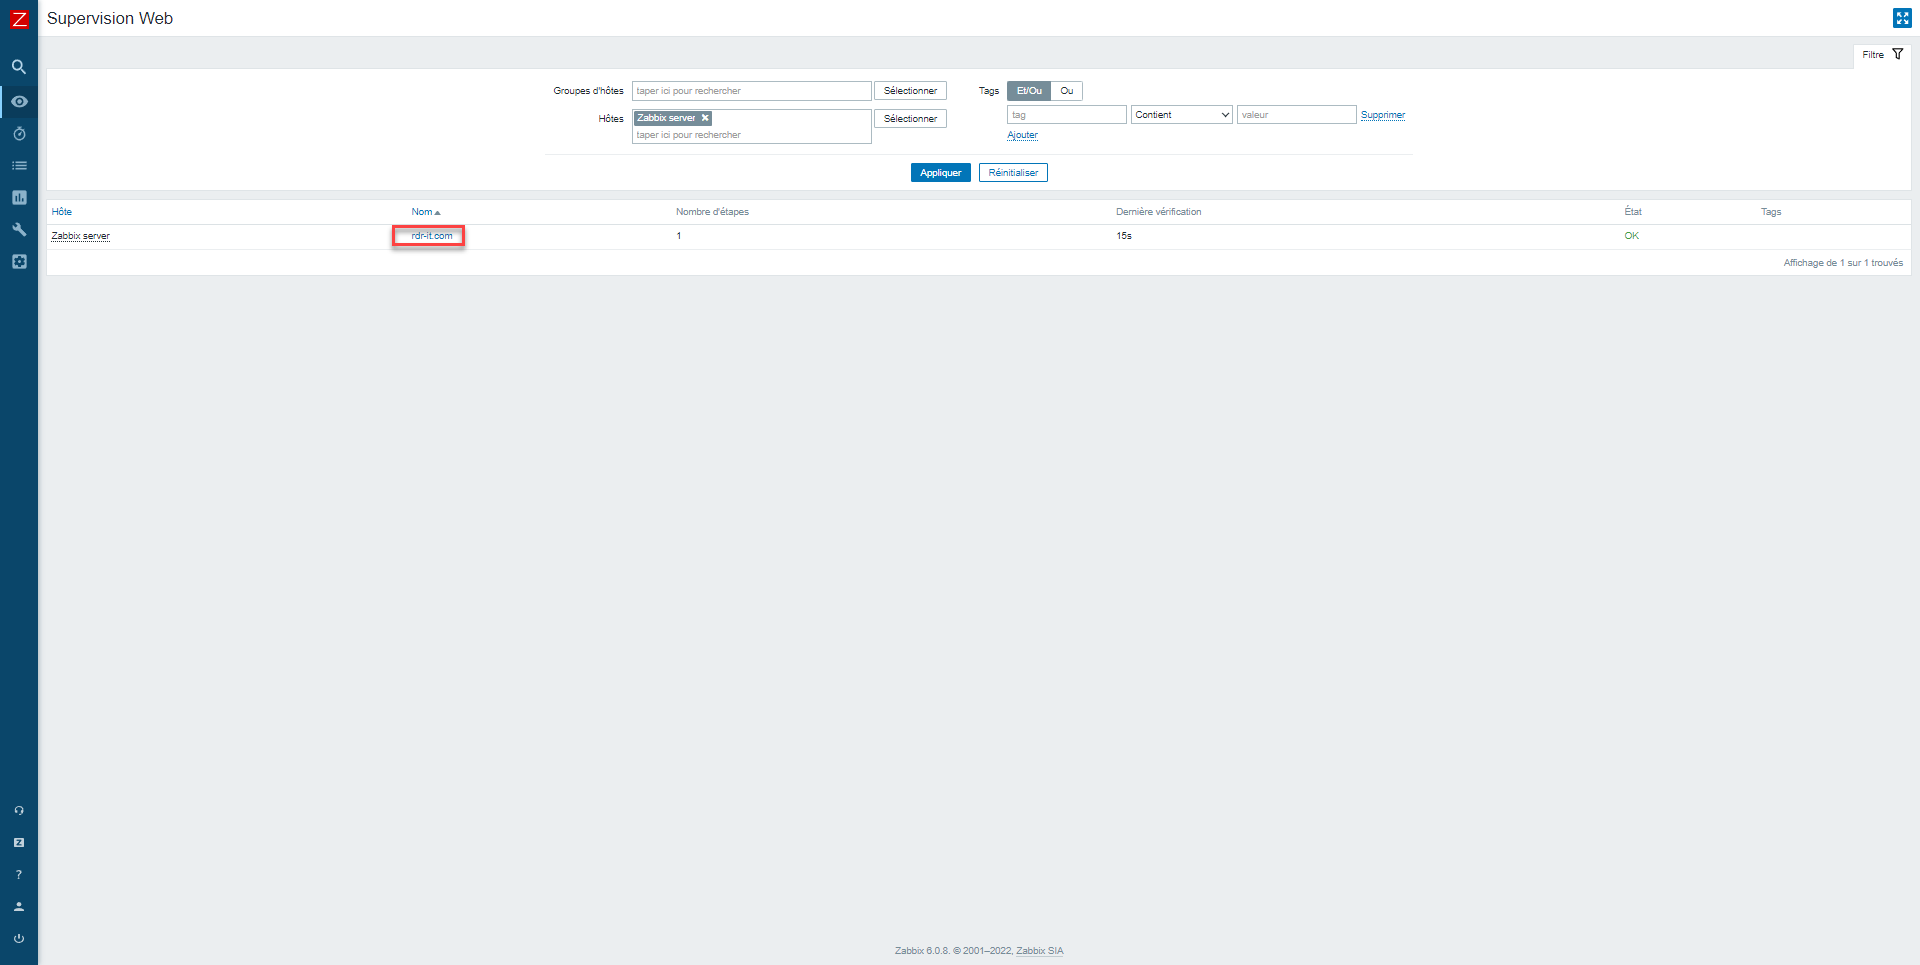
The list of websites supervised by the agent is displayed, click on it to access the details.
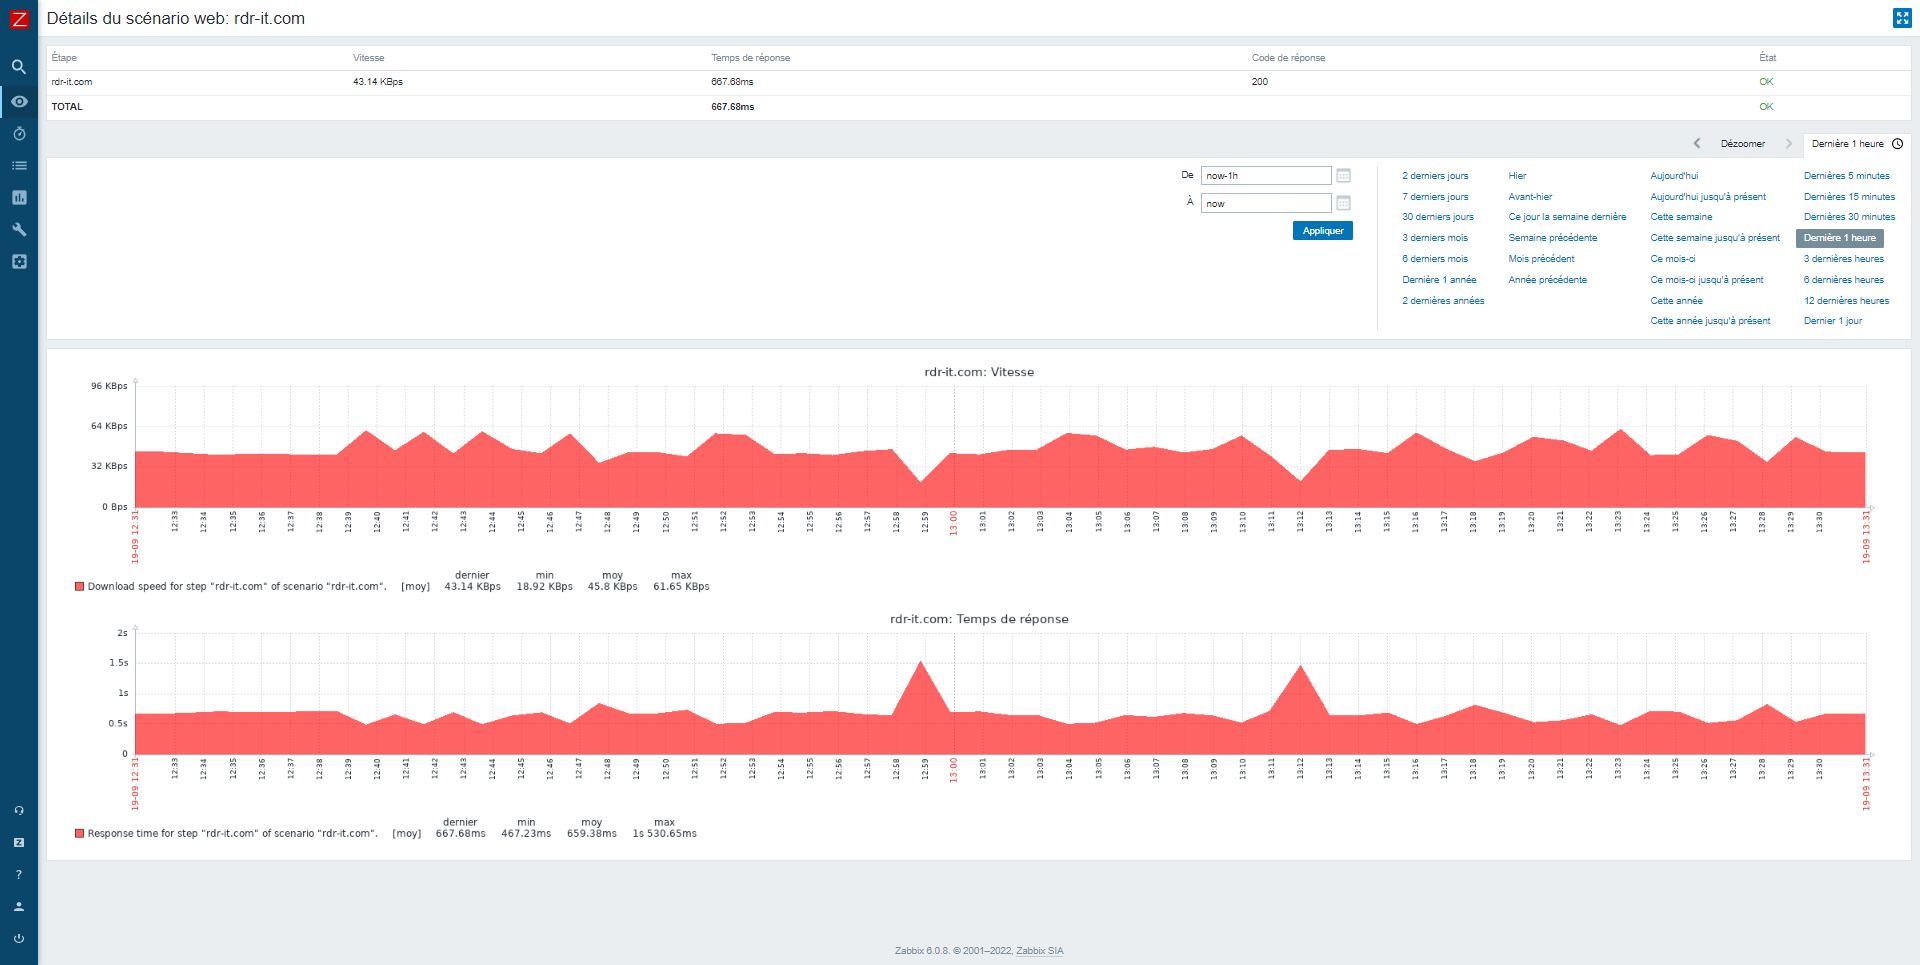
We then arrive at the dashboard with the latest values and a graphical suite linked to the website.
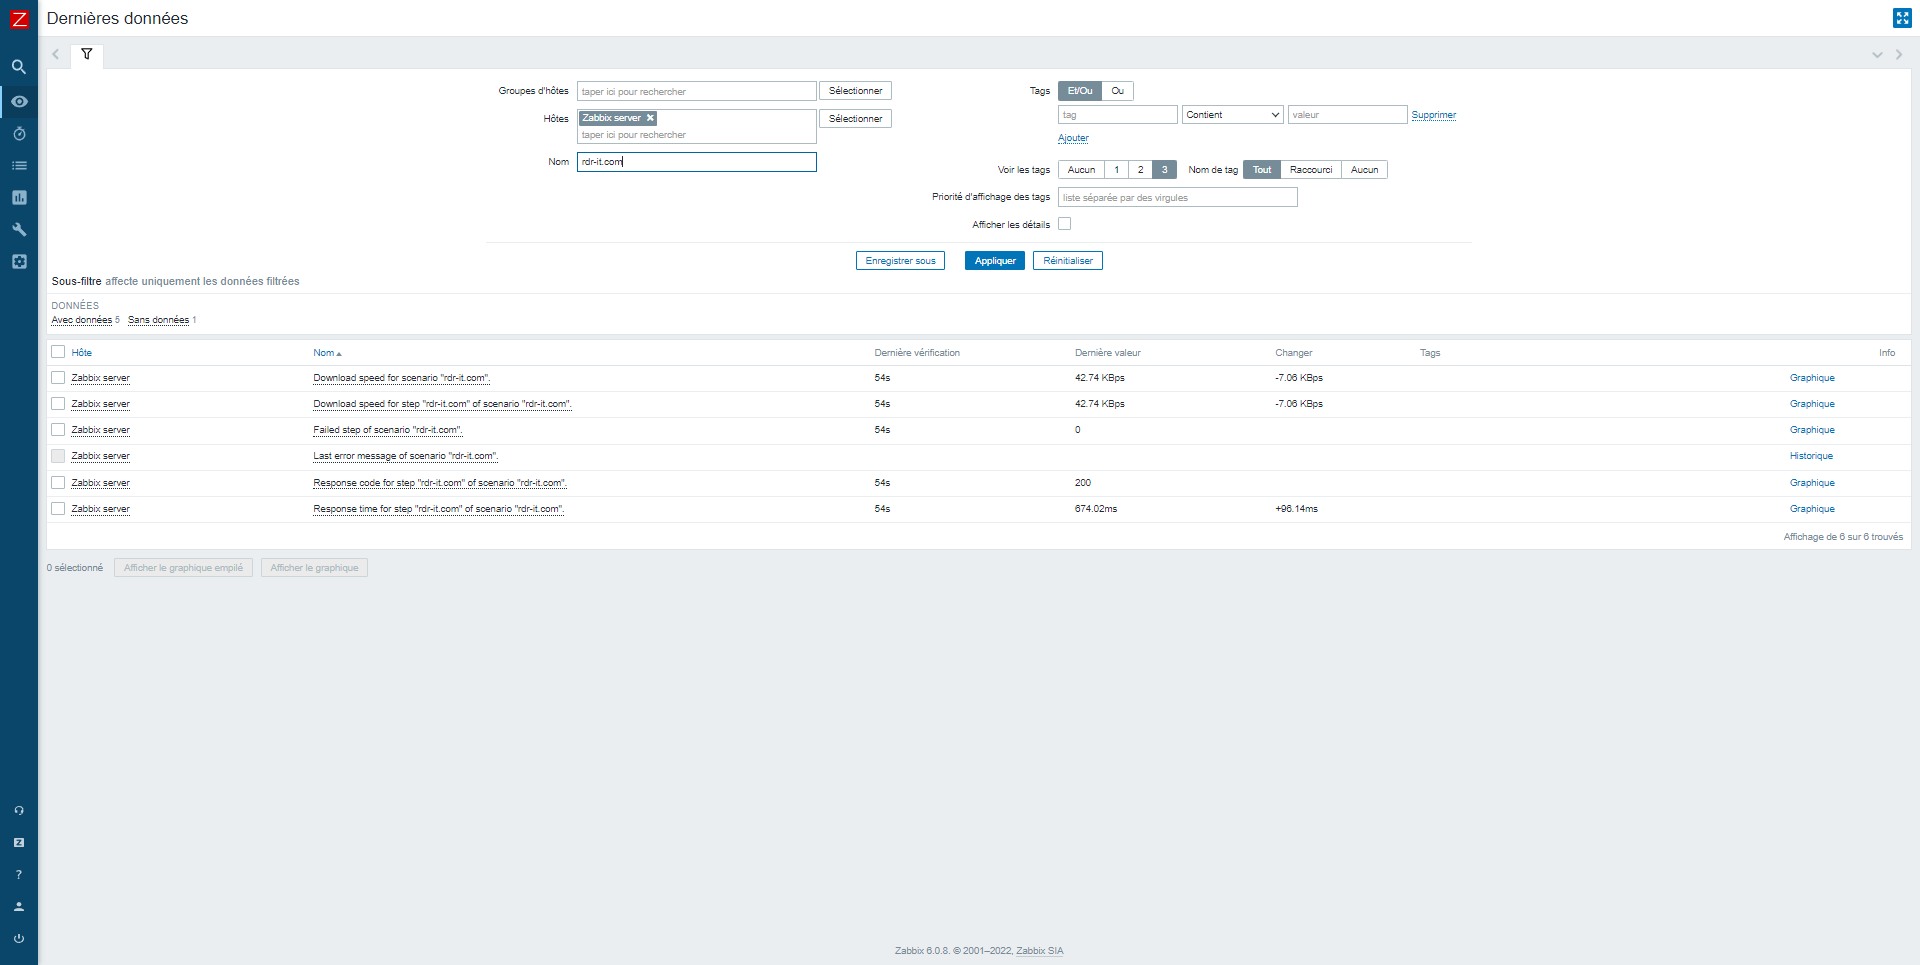
You can also access all the data from the latest data on the host if you need to have more history, particularly for response codes.
You now know how to monitor a website with Zabbix.