

In MDT, it is possible to activate the monitoring, which makes it possible to follow the deployment of the stations and to have a progress report from the console. The state of the deployments is kept for 3 days.
Activation of the monitoring
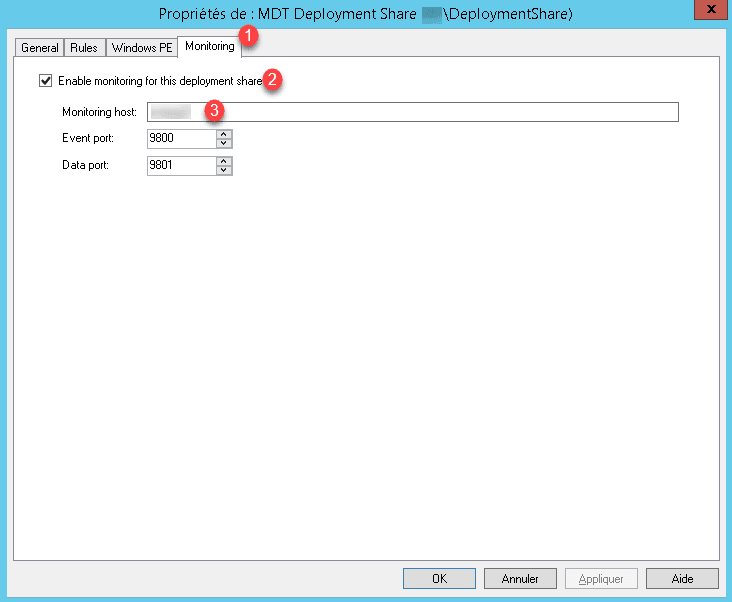
To enable monitoring, right-click on the MDT share and click Properties. Go to the Monitoring tab 1 , select the Enable monitoring for this deployment 2 check box and enter the IP address or host name of the MDT server 3 .
Then go to the Rules 1 tab and in the Default section add the parameter EventService 2 indicating the name of the MDT server and the port (9800), click on Apply 3 and OK 4.
EventService=http://server-mdt:9800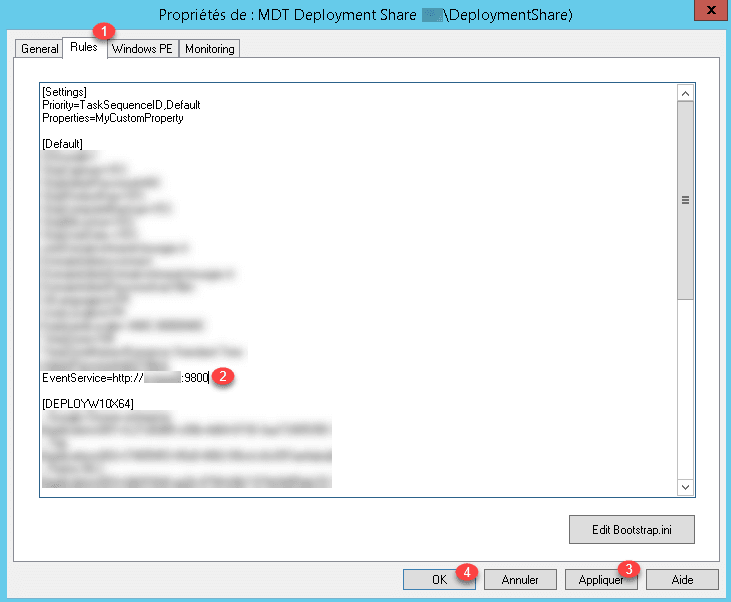
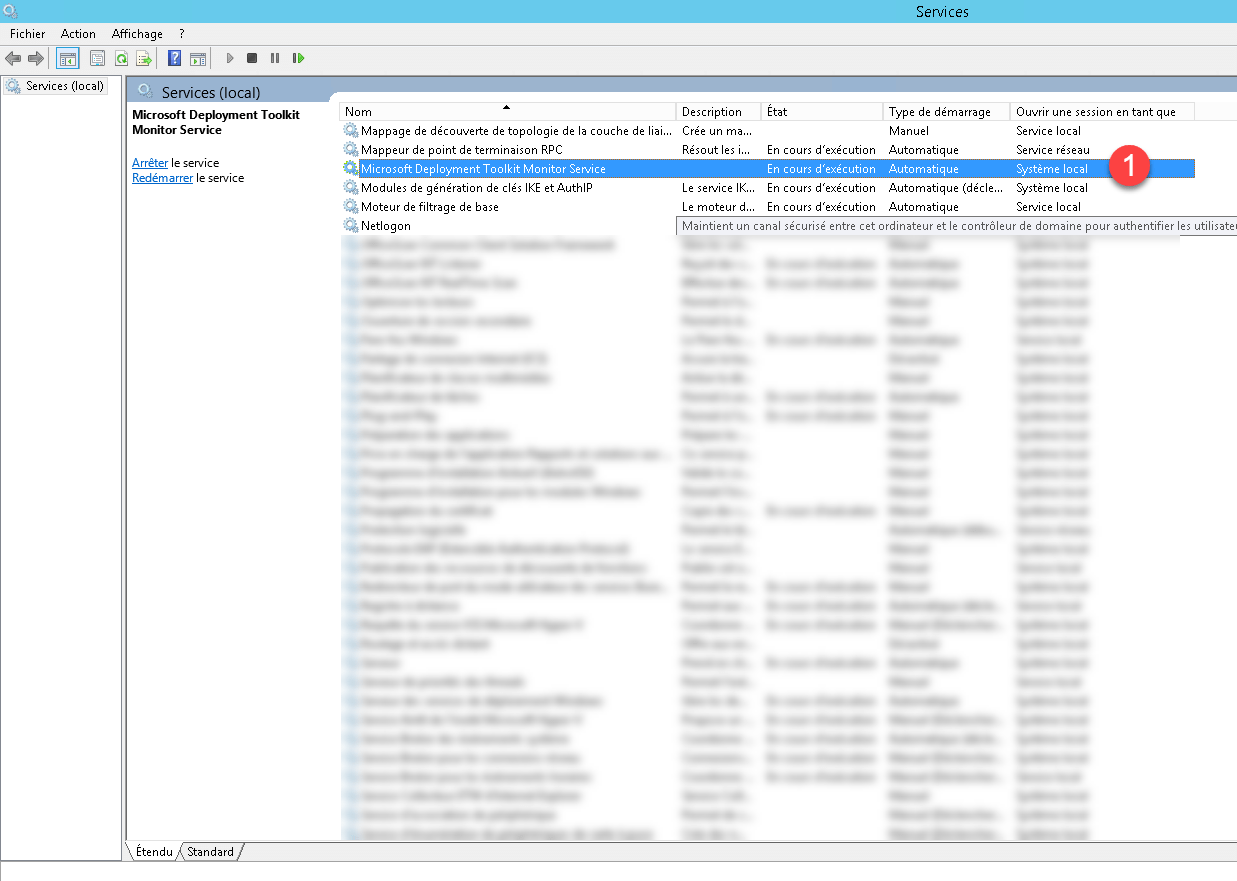
Open the services on the MDT server and verify that the Microsoft Deployment Toolkit Monitor Service 1 is running.
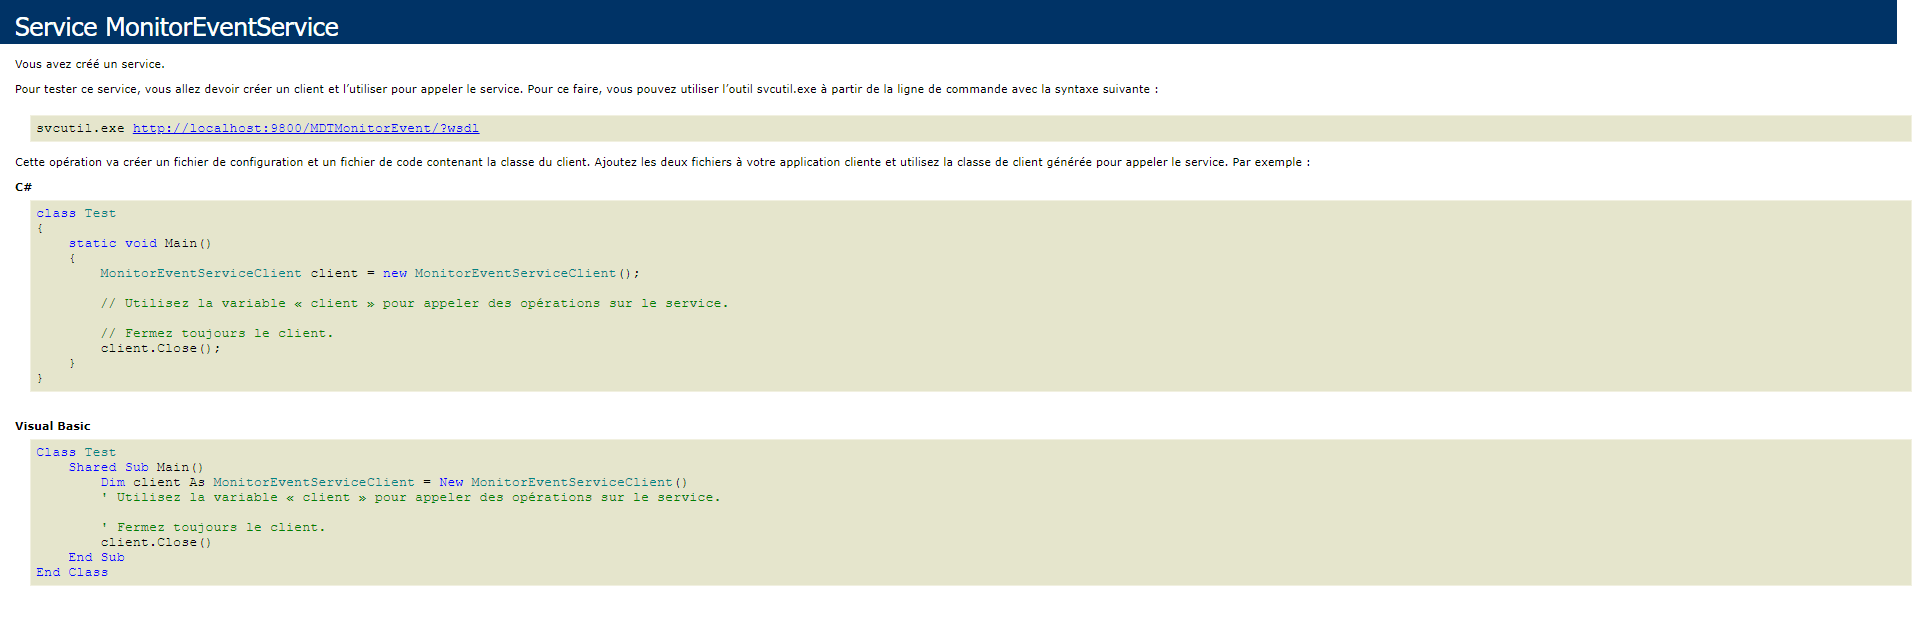
To test that the service is running, on the MDT server, open an internet browser and enter the following address: http // localhost: 9800 / MDTMonitorEvent /, the following page should appear. If this is not the case check the firewall or try to restart the service.
Test the monitoring
Start a deployment from the MDT service, once it is in progress, go to the MDT console and click on Monitoring 1 . The item being deployed 2 should be displayed.
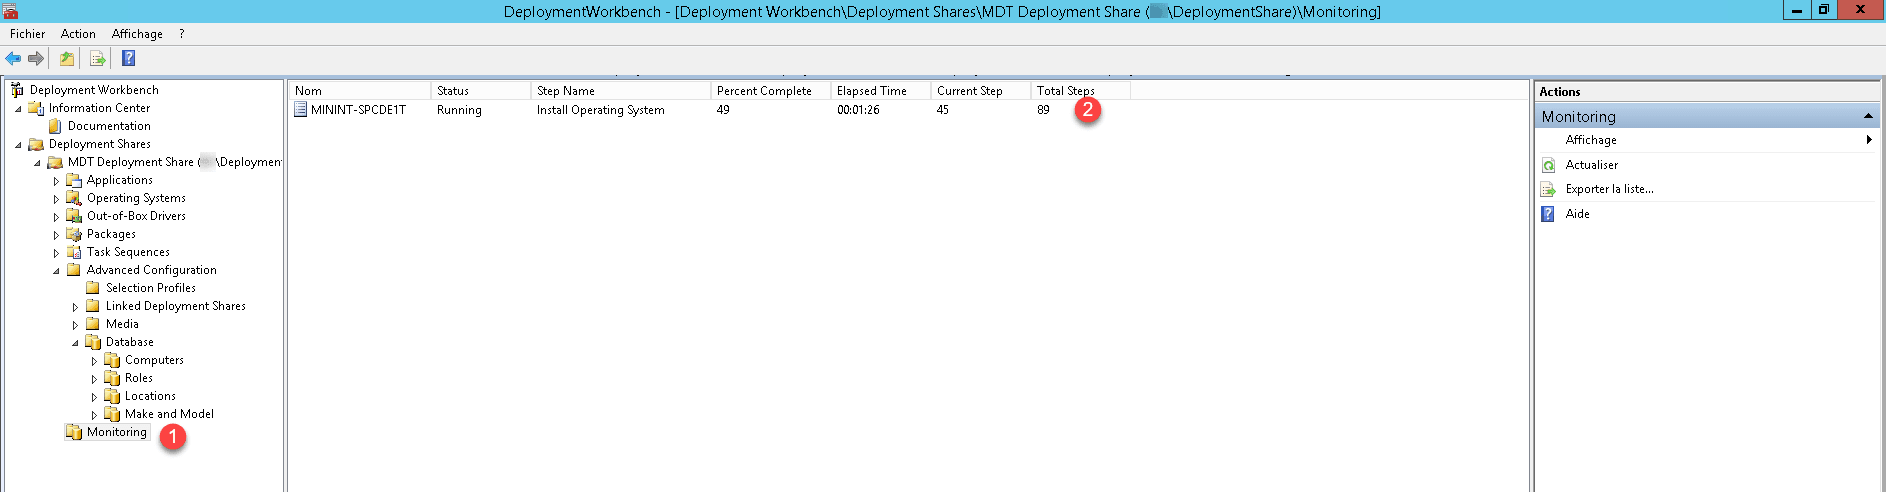
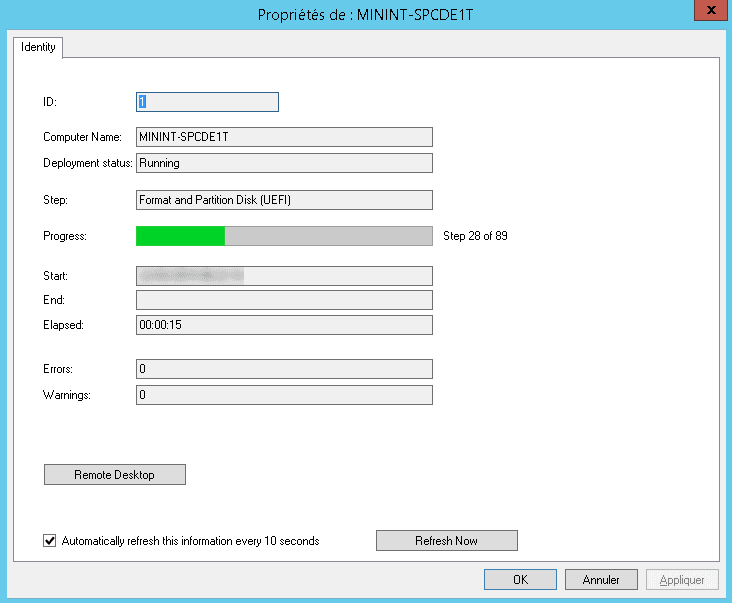
To view details and progress, simply double click on the item.
Customize the monitoring
Change the retention of deployments
It is possible to change the number of days in the deployment history. Open the Microsoft.BDD.MonitorService.exe.config file that is located in C: \ Program Files \ Microsoft Deployment Toolkit \ Monitor and change the value of the MaxDays parameter.
<setting name="MaxDays" serializeAs="String">
     <value>3</value>
</setting>
Restart the Microsoft Deployment Toolkit Monitor Service to apply the new settings.
Advanced monitoring tools
If you want advanced tools to oversee your deployments, the site Syst & Deploy offers several scripts.